
The Current Fiscal Path is Unsustainable. Will We Do the Right Thing?
Bi-partisan deficit spending has raised the US national debt held by the public toward 100% of GDP.
The Fiscal Service of the US Treasury Department projects rising deficits and unsustainable debt in the years and decades ahead.
Projected deficits and debt would cause an ominous spiral of inflation, rising interest rates, falling growth, and ever higher debt and deficits.
Fortunately, necessary fiscal reform is economically easy. Unfortunately, it’s politically difficult.
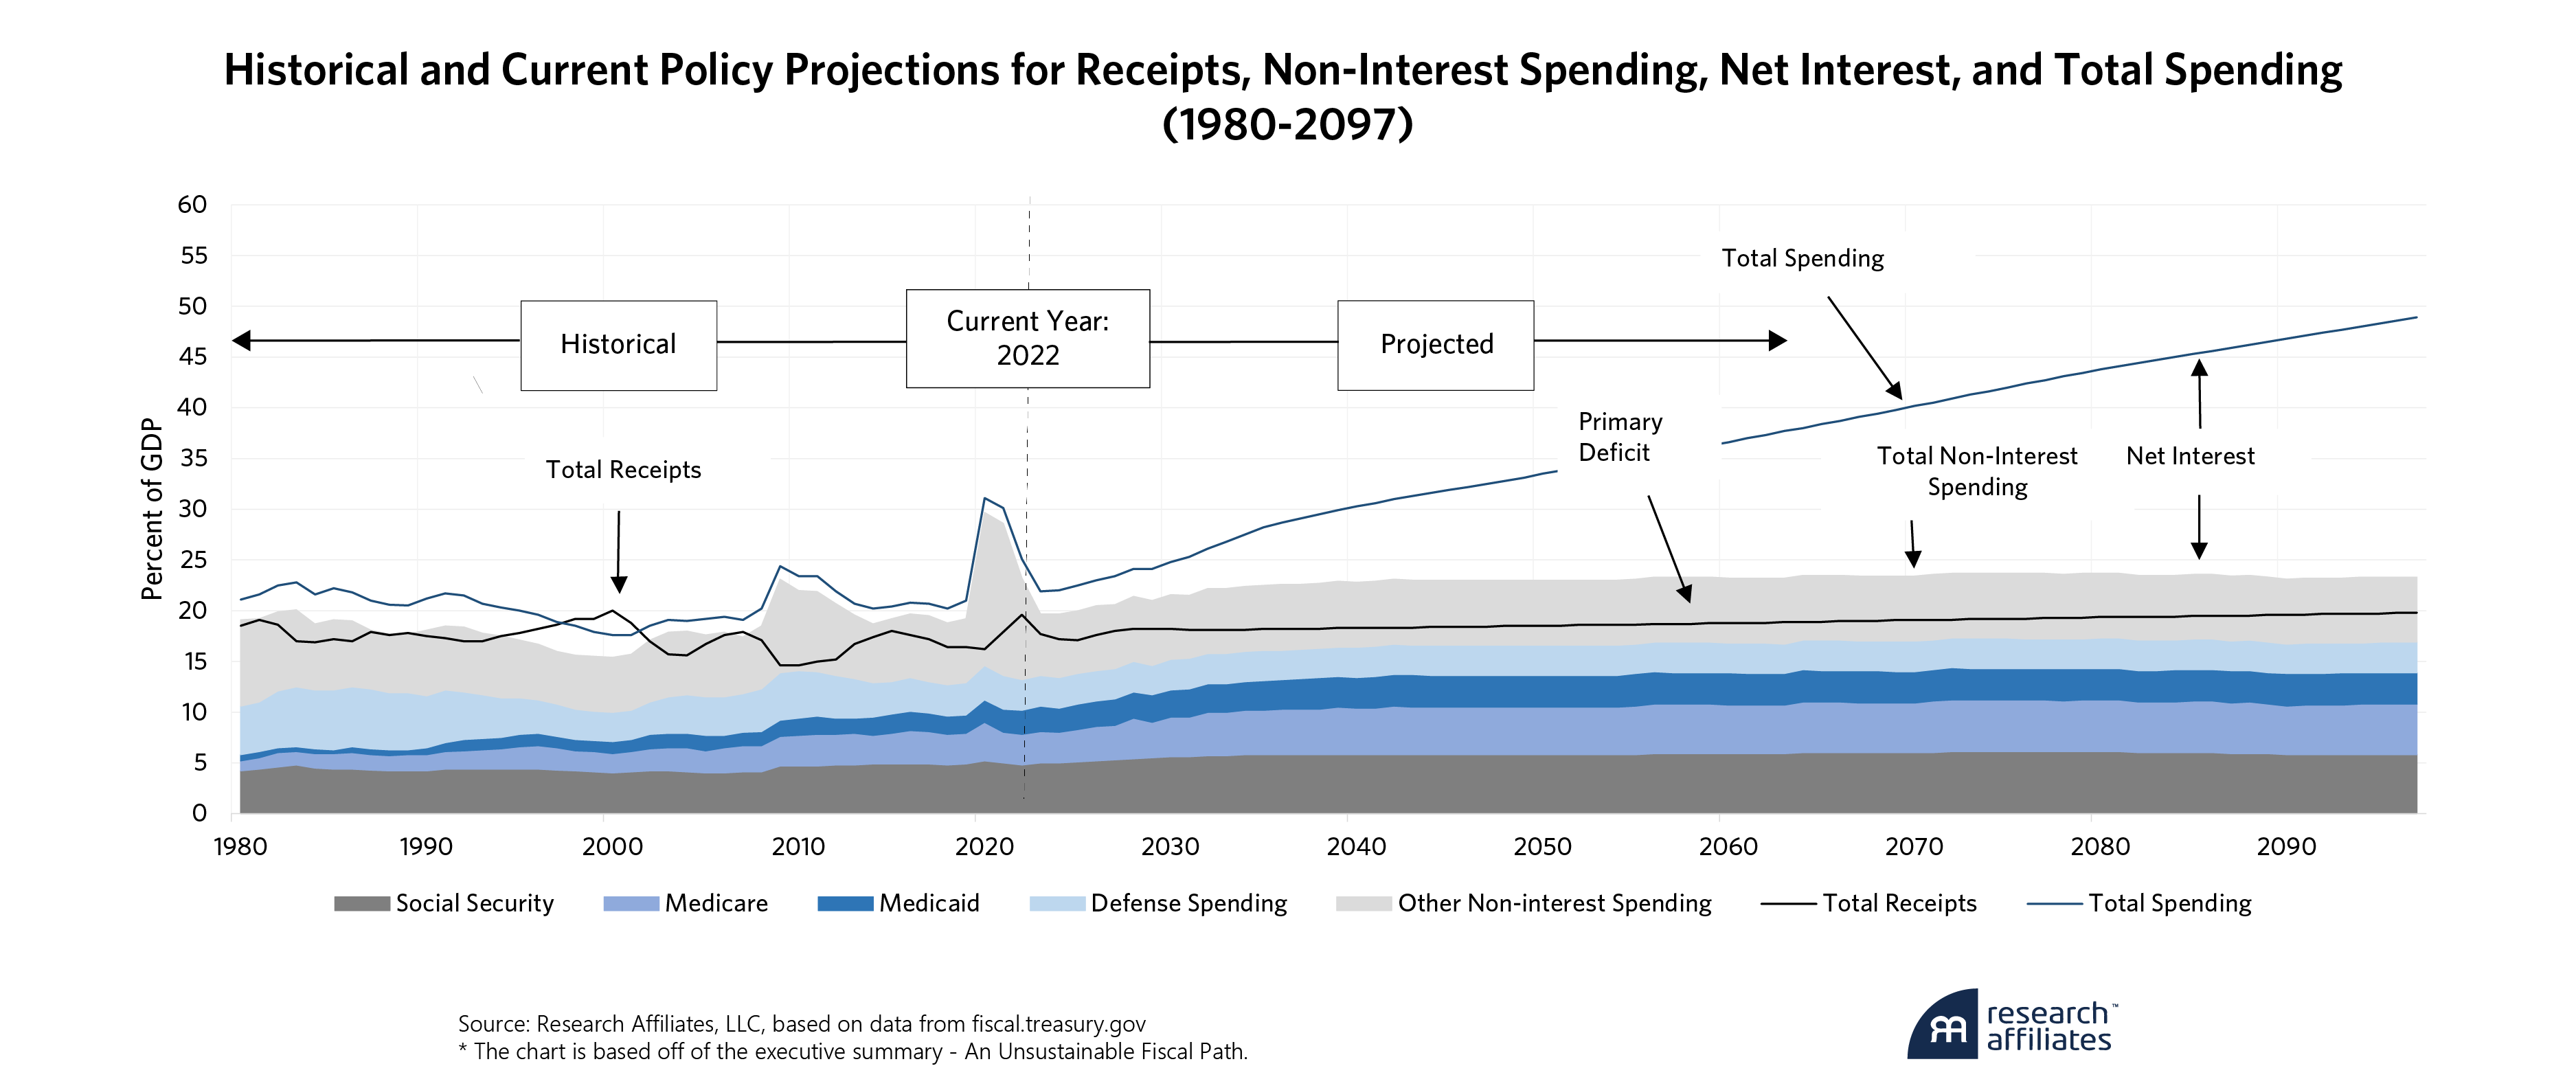
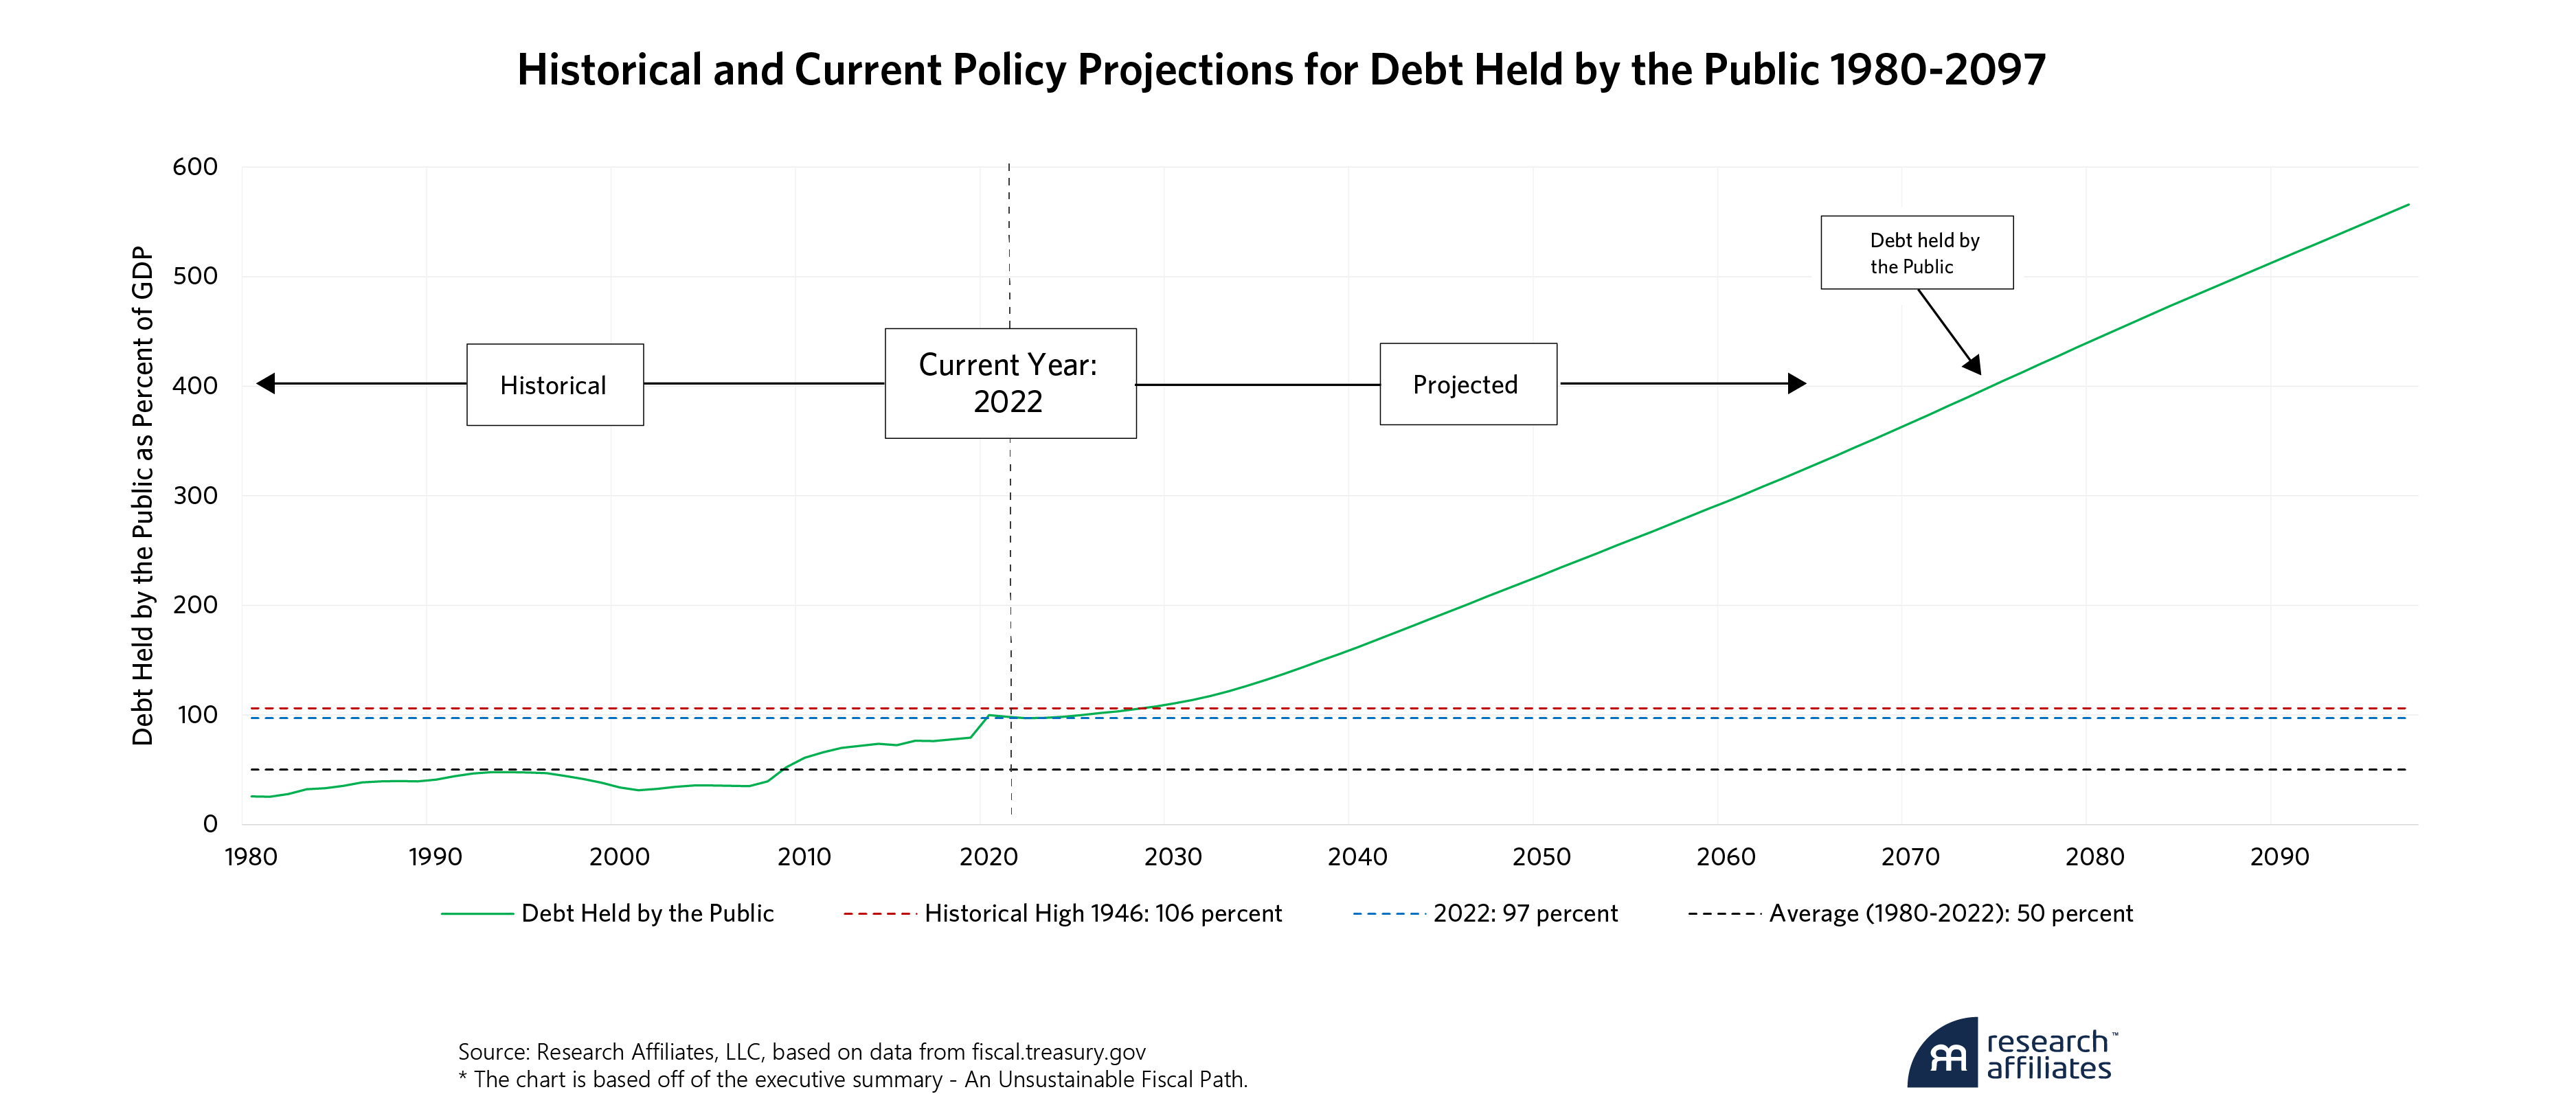
“The current fiscal path is unsustainable”. This stark warning comes from the US Treasury Department’s Bureau of the Fiscal Service’s fiscal year-end projections1. Based on current appropriations and tax law, these projections display steadily rising federal spending and flat tax receipts, as a percentage of GDP. Our resulting deficits push projected federal debt held by the public up from near 100% of GDP today to 200% by the mid-2040s and above 500% before 2100.
Create your free account or log in to keep reading.
Register or Log in
As result of these worrisome projections, many prognosticate fiscal doom. No one more concisely expresses our fiscal challenge than financial commentator John Mauldin. In his January 13th Thoughts from the Frontline, John writes:
The sad fact is we have no easy way out of the debt situation. Worse, we are actually choosing this fate. It’s not about individual choices; none of us want the crisis that’s coming. But all the solutions require joint actions we are apparently unable to take. Which means we are, by default, choosing a path which for many will be catastrophe.
We face this not just because of government policy choices but the political process itself. It is a function of the two-party system. Our system has lost the ability to act decisively against big problems we all see coming. We are a nation of deer in the headlights2.
I’m more optimistic. Fortunately, necessary fiscal reform is economically easy. Entitlement reform, such as raising the retirement age to receive full Social Security benefits and raising the maximum income level for assessing Social Security taxes, and/or broad-based tax reform, such as introducing a national value added tax (VAT), could readily erase most or all the US federal deficit, thus producing a sustainable trajectory for government debt.
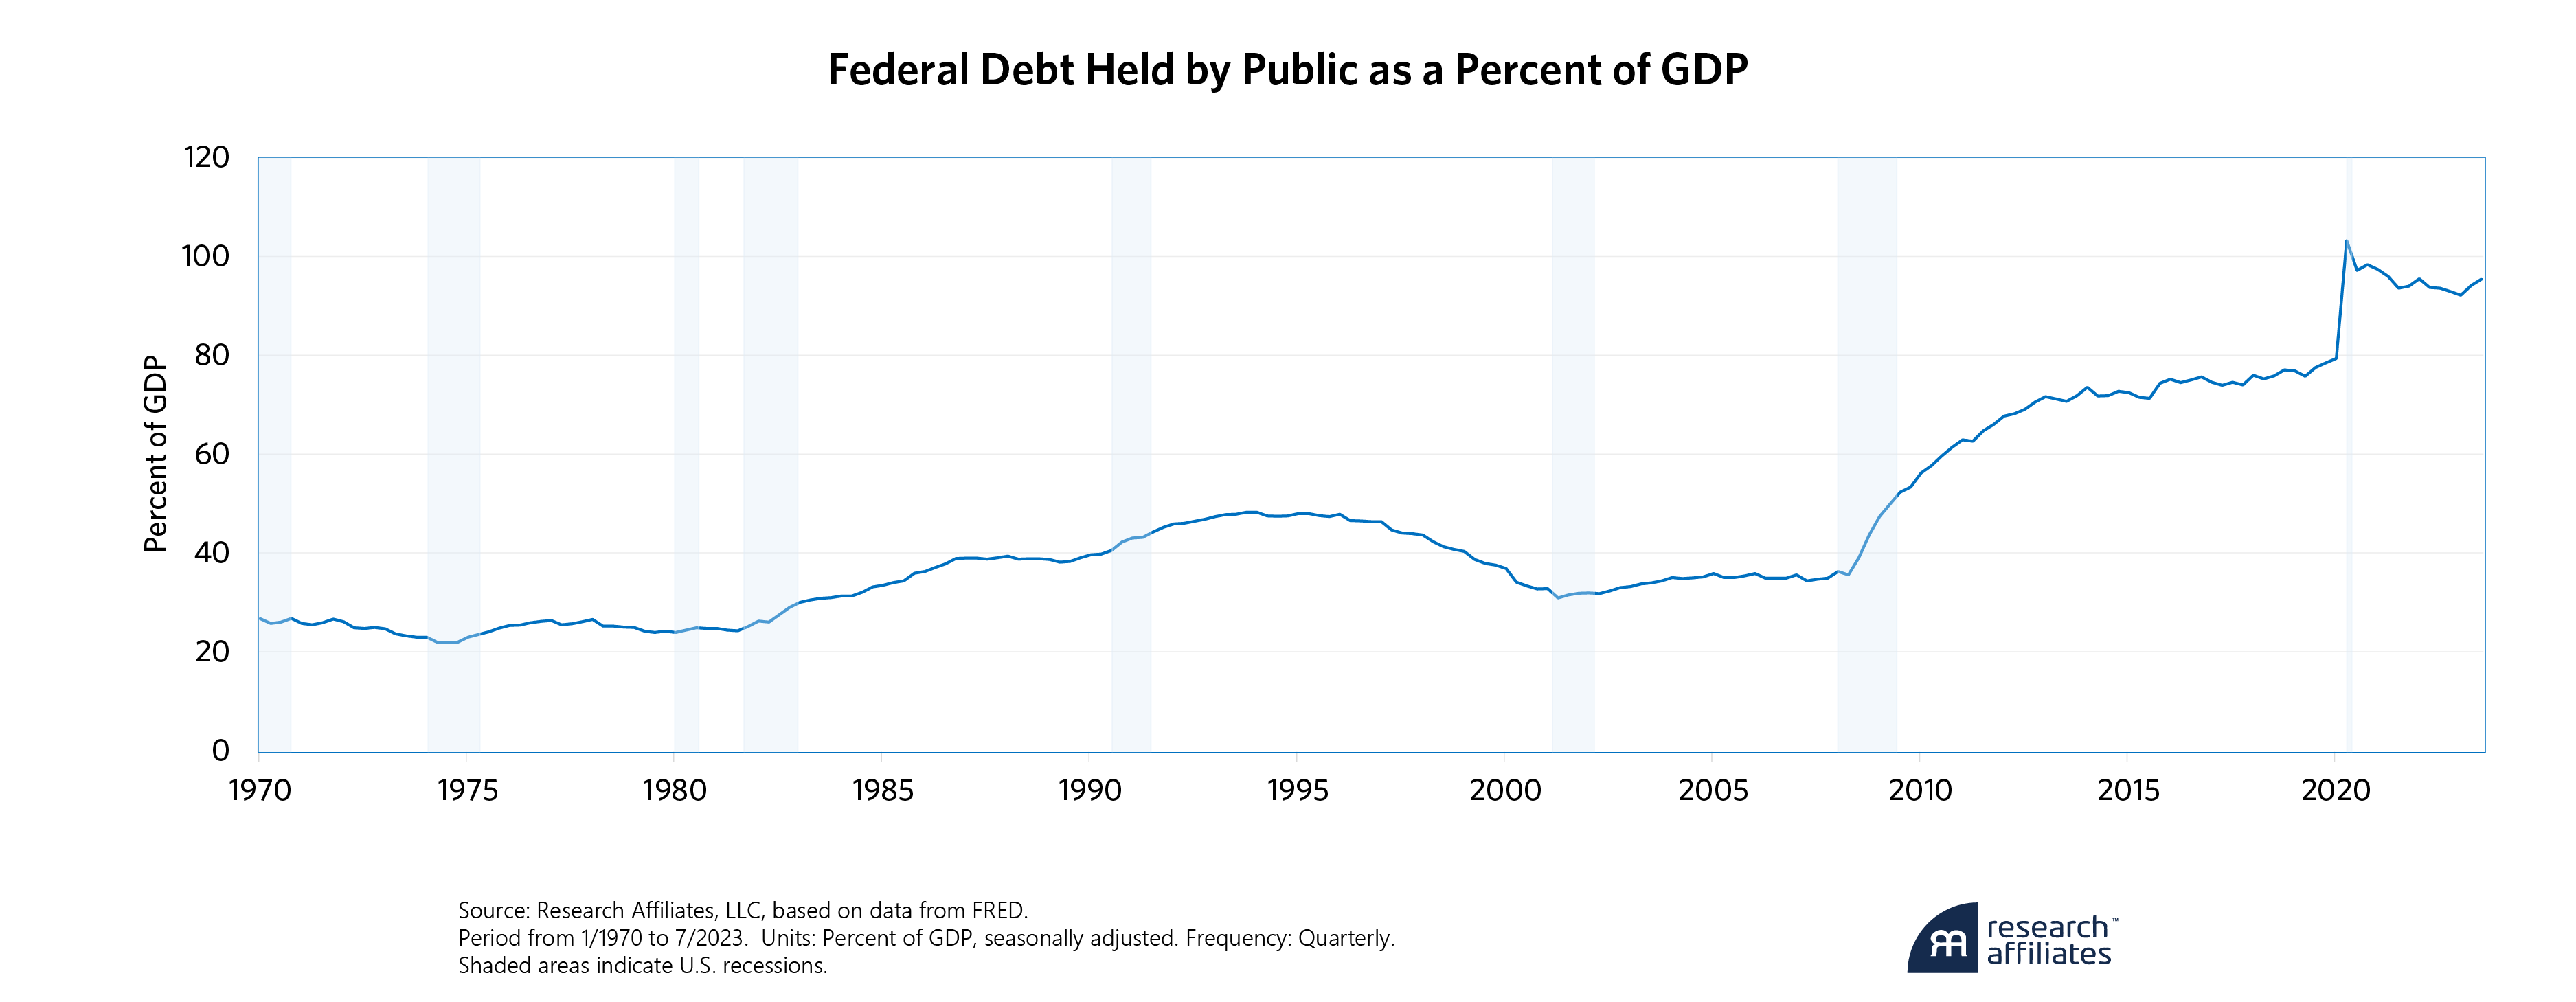
Since 2008, deficit spending has exploded, and government debt held by the public has rocketed upward.
”Unfortunately, necessary fiscal reform is politically difficult. Worrisomely, among the few policies Biden Democrats and Trump Republicans seem to agree upon is the political expediency of deficit spending.
From today’s debt level, projected deficit spending would initiate an ominous spiral of inflation, rising interest rates, higher debt service costs, more unsustainable debt and thus even larger deficits. The risk of failing to act is just too great to be ignored. As Winston Churchill mythically said, “Americans will always do the right thing… after they’ve exhausted all the alternatives.”
How did we get here?
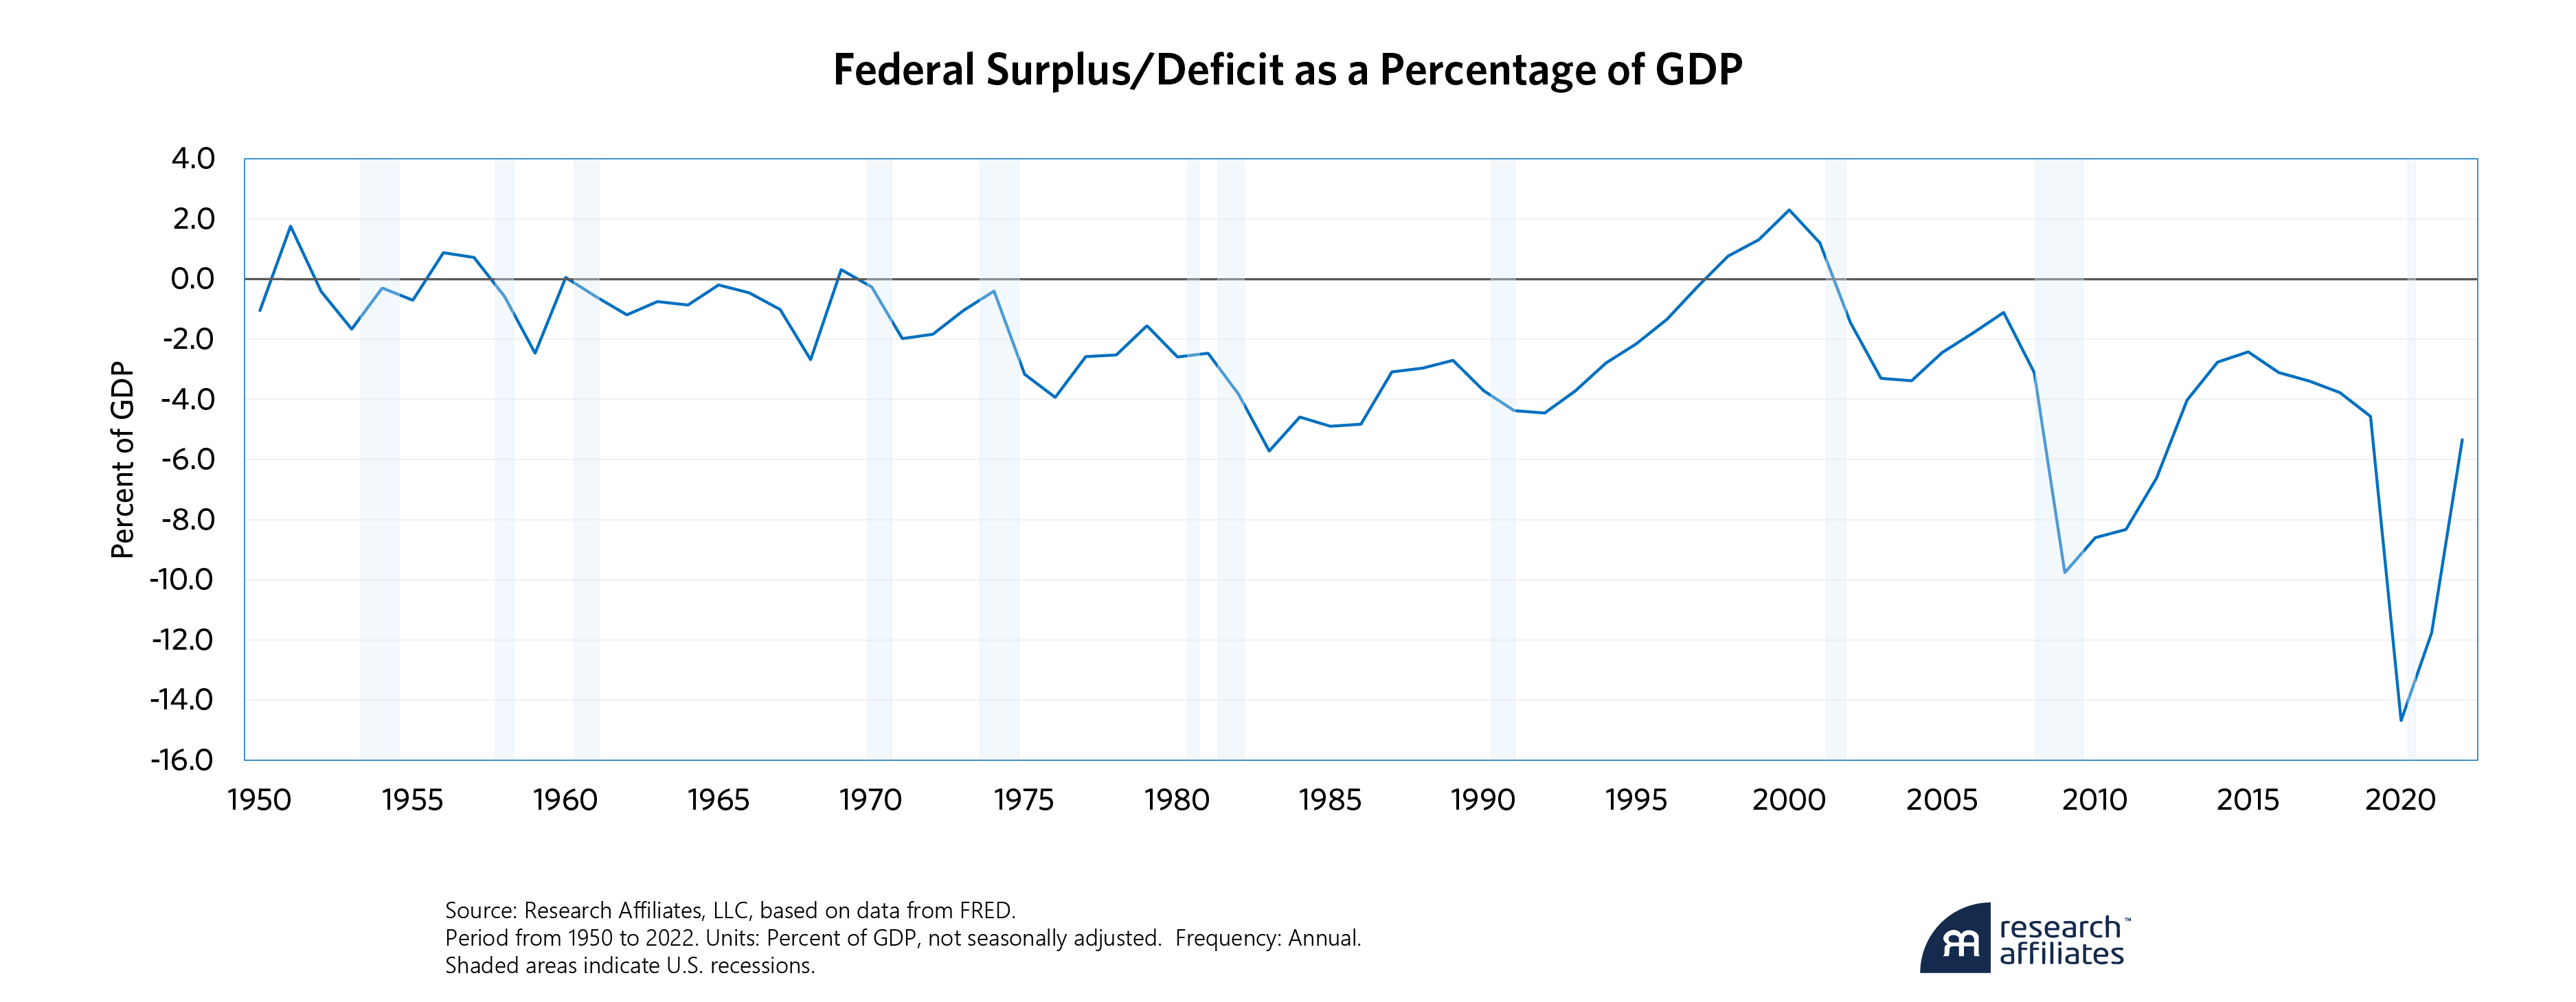
The US fiscal problem stems from exploding deficits. Our largest deficits were incurred during the global financial crisis (GFC), and then again during and following the pandemic, but we have continued to run deficits during periods of booming growth and record low unemployment, including now.
From World War II through the mid-1970s the US government kept its budget deficits near balance, never exceeding 3% of GDP and occasionally running surpluses. In 1976, the budget deficit widened to 4%. Following the dual recessions of the early 1980s, the deficit widened to 6% of GDP in 1983. The deficits of the 1980s and early 1990s nearly doubled debt held by the public from 25% to 47% of GDP.
Then, the booming economy of the 1990s, along with the fiscal discipline of a Clinton administration constrained by a hostile Republican Congress, created four years of budget surpluses. These surpluses, along with strong GDP growth, reduced debt to GDP to a recent low of 31% in 2001.
Our debt remained at a manageable level below 40% of GDP until the GFC in 2008. Since then, bipartisan fiscal policy has produced enormous deficits, rising to 10% in 2009, falling back to 3% to 4% during the mid-teens and exploding again to 15% in 2020. The current budget deficit remains over 5% of GDP.
As a result of this recent deficit spending, US government debt held by the public has rocketed upward to today’s level of nearly 100% of GDP. Recall that the Fiscal Bureau projects debt rising to 200% by the mid-2040s and above 500% before 2100.
Is US Government Spending sustainable?
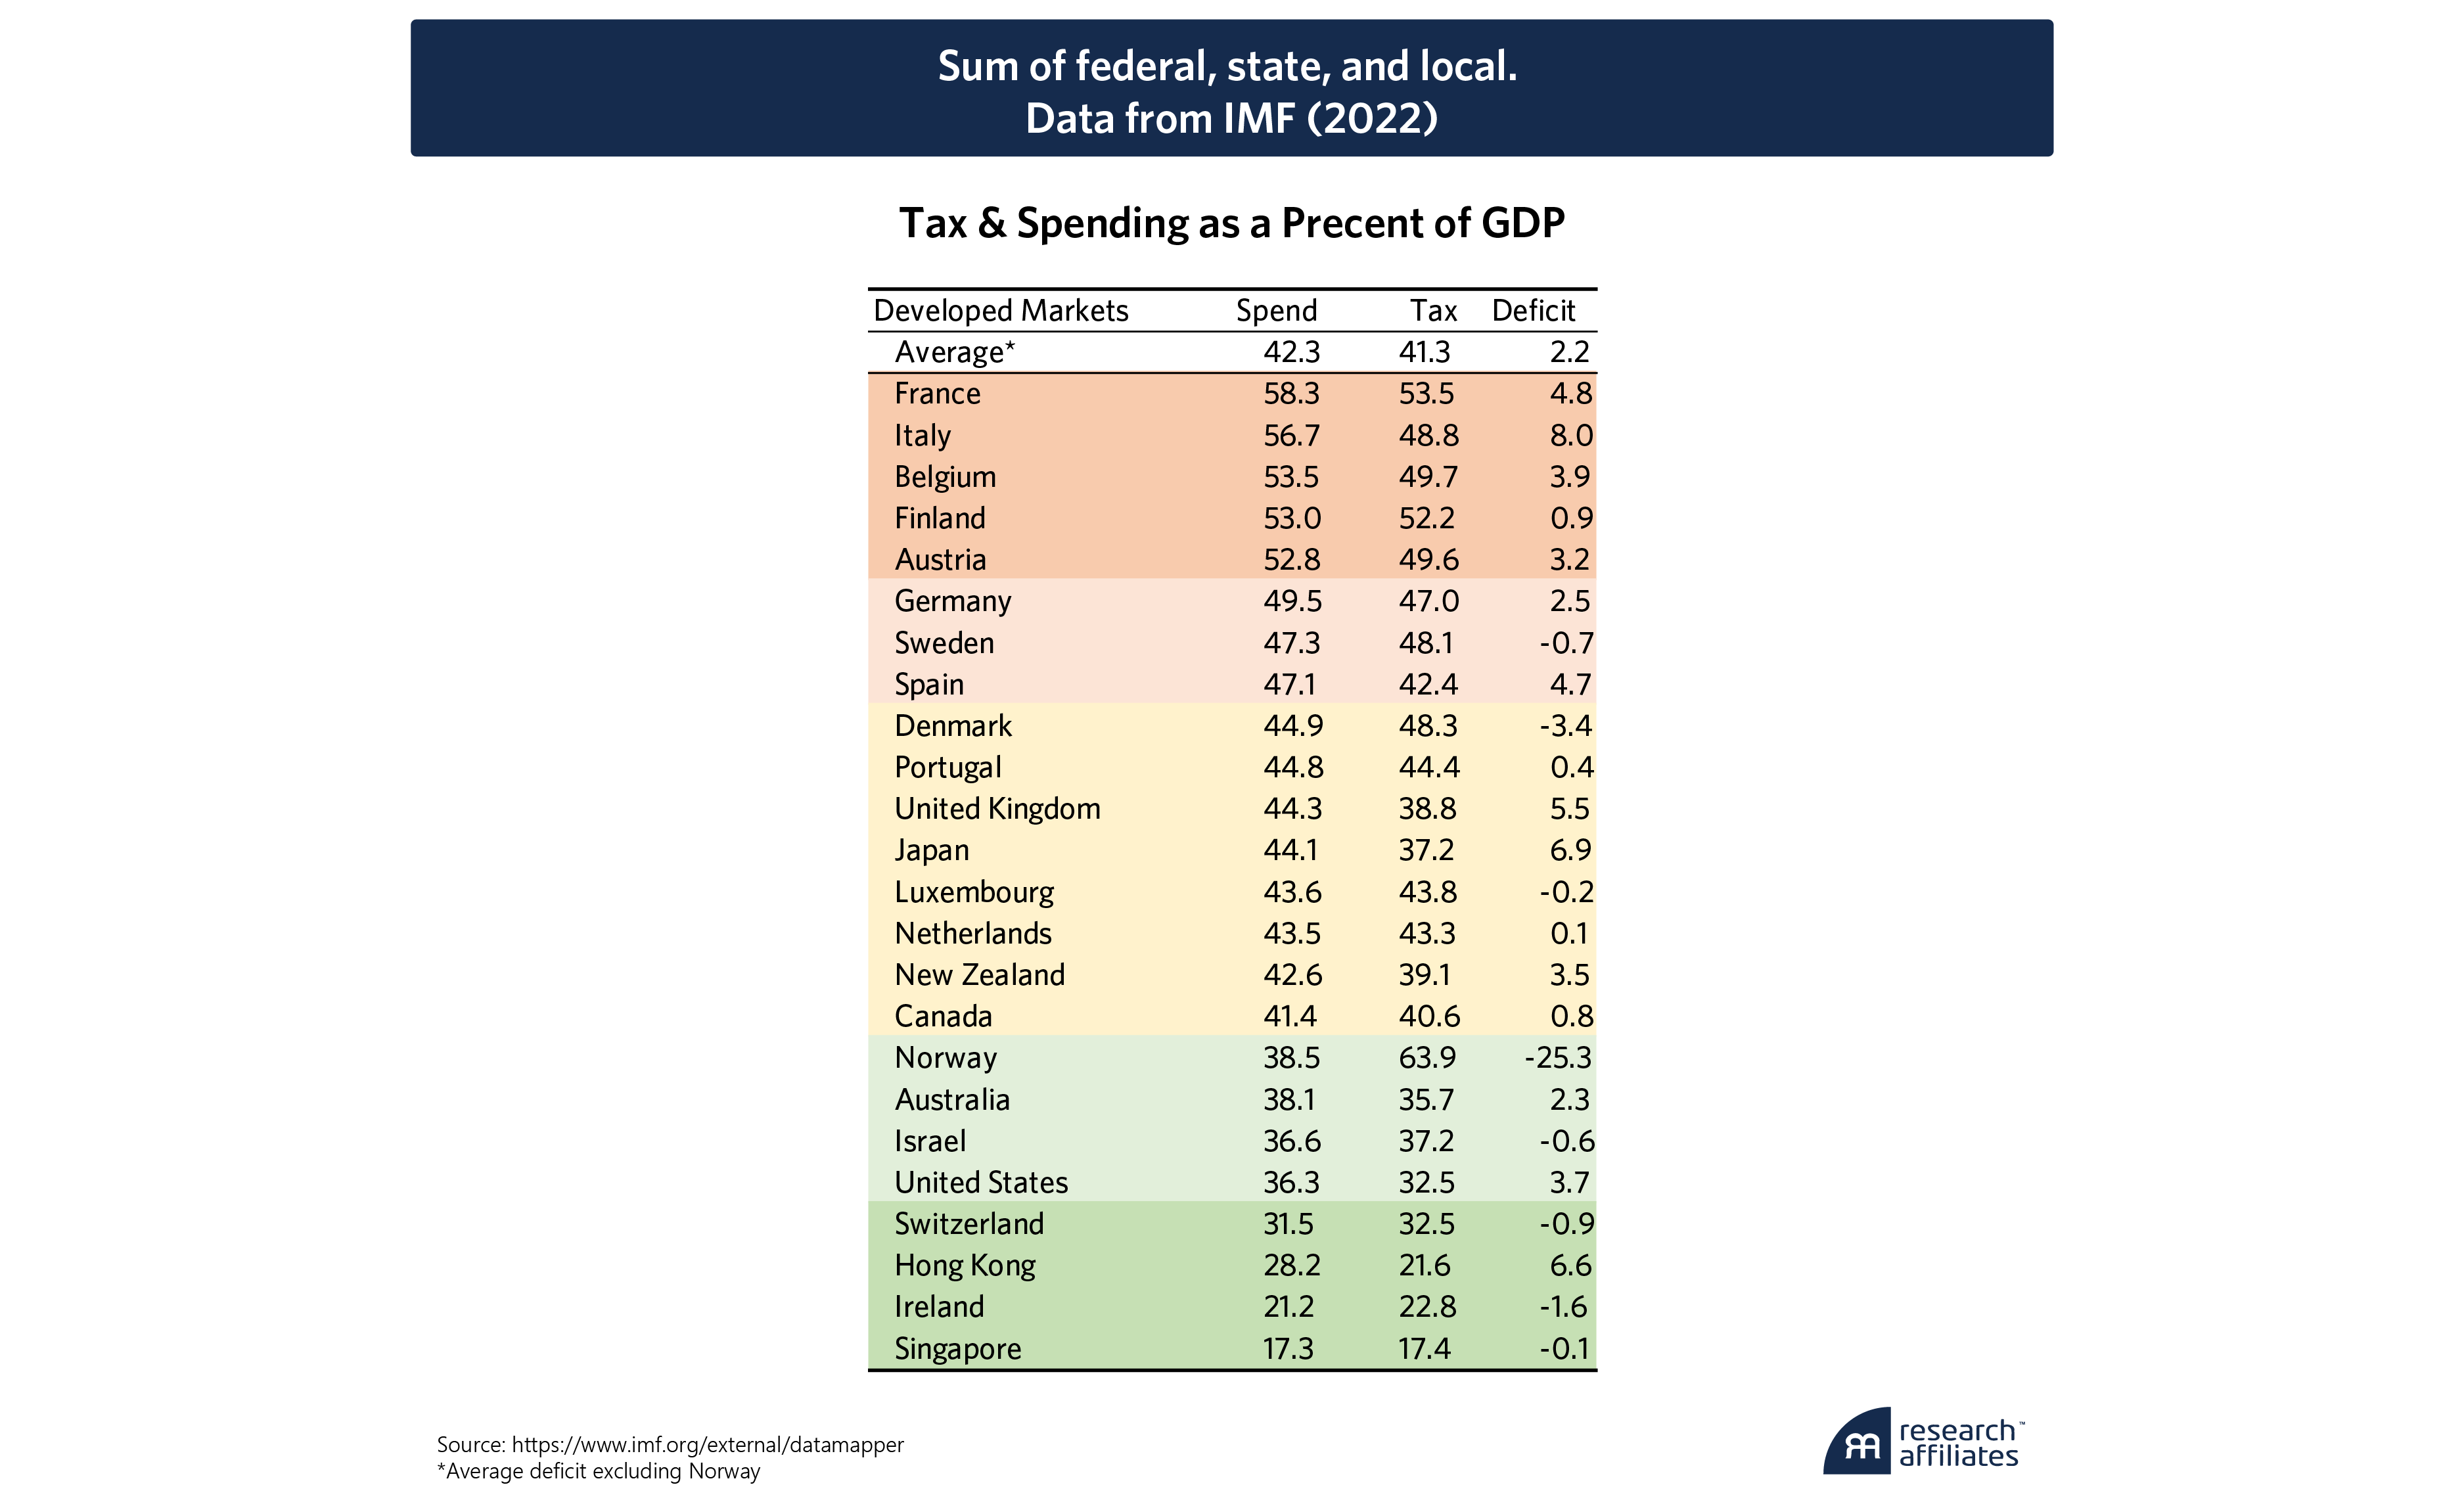
Empirically, compared to other developed market countries, yes. The US could eliminate its budget deficit by taking total tax receipts (federal, state and local) up from today’s 32% of GDP to the level of total US government spending at 36% of GDP. A national VAT would do so quite effectively.
How Much Should Government Spend?
As a matter of political economic philosophy, I believe many developed countries have a scale of government spending that not just retards growth, but also limits liberty and generally depresses human flourishing, as eloquently explained by Edmund Phelps3.
The composition of spending, however, is as important as its level. Spending on courts, police and national defense are necessary to protect property, ensure rule of law and enforce contracts. Investments in infrastructure, health and education enhance growth and human welfare. Some amount of income transfer seems necessary to keep social peace. Subsidies, industrial policy and graft are generally harmful. Efficiency, transparency and honesty are also important but difficult to quantify.
How Much Do Governments Spend?
According to data from the IMF, total government spending (federal, state, and local) in developed market countries averages about 42% of GDP (versus 30% in emerging markets (EM) /lesser developed countries). Among developed market countries, total government spending ranges from about average at 40% to 45% of GDP in the UK, Japan, Netherlands and Canada; to a bit above average at 45% to 50% of GDP in Germany, Sweden and Spain; to a bit below average at 35% to 40% of GDP in Australia and the US. Governments of some European countries, including France and Italy, spend more than 50% of their GDP.
The US could eliminate its budget deficit by taking total tax receipts up from today’s 30% of GDP to the level of total US government spending at 36% of GDP.
”Governments of some small, very wealthy developed countries, including Switzerland, Ireland and Singapore, spend less than 30% of their GDP. Because Switzerland has twice the per capita GDP of the UK, its government spending as a percent of GDP would be double if its per capita GDP were at the level of the UK. In other words, the Swiss government spends significantly more per person than the UK even though its spending as a percent of GDP is substantially lower.
I would prefer to start a new business in the US or Australia rather than one of the European countries with the highest spending and taxes. Nonetheless, my recent travels in Europe confirm that life in France and Italy seems quite comfortable. In contrast, life seems difficult in countries whose governments spend less than 20% of their GDP (acknowledging the city-state of Singapore as an exception).
Outside of developed market countries, spending as a percent of GDP is positively correlated with income and development. Governments of relatively prosperous European EM countries, including Poland, Hungary, and the Czech Republic, spend more than 40% of their GDP. The Brazilian government also spends more than 40% its GDP. Governments of many other more developed EM countries, including Russia, Estonia, and Argentina, spend near the average of developed countries at 35% to 40% of GDP.
Governments of large, middle-income countries spend between 25% and 35% of GDP including China, South Africa, Korea, India, Mexico, Turkey, the Philippines and Malaysia. Governments of some smaller, lower middle-income countries in Southeast Asia and Latin America spend 20% to 25% of GDP, including Cambodia, Thailand, Peru, Paraguay and Panama.
The near absence of government makes life nasty, brutish and short. Lower-income countries, including Pakistan, Myanmar and Sudan, spend between 15% and 20% of their GDP. The governments of struggling (failing?) states, including Guatemala, Bangladesh, Iran, Venezuela and Lebanon, spend less than 15% of their country’s GDP. Haiti’s “government” spends less than 10% of its paltry GDP.
How Big is the US Government’s Debt?
What is the current level of US federal debt? Answering this question is more difficult than you might imagine.
A real-time observation4 of total federal debt is now over $34 trillion (T) and growing. The Congressional Budget Office (CBO), however, reports5 not that total, but a different quantity labeled “debt held by the public” of $26T. The difference is $7T of intergovernmental debt6 (the Social Security trust fund and various government retirement and insurance funds). Furthermore, the Fed holds $4.7T of US Treasuries on its balance sheet. If we classify the Fed as part of the government, then debt held by the public is “only” $22T.
Economists rightly exclude intergovernmental debt because, when we lend and borrow money to/from ourselves, the result is more mental accounting than real debt; we receive the interest we pay to ourselves.
More relevant than debt expressed in dollars is debt divided by the level of US GDP7, currently $28T. Thus, gross federal debt equals 121% of GDP, debt held by the public equals 93% of GDP, and further excluding debt held by the Fed, our federal debt held by the public equals “only” 79% of GDP.
How Large are US Budget Deficits?
When we analyze debt sustainability, deficits are as important as the accumulated level of debt. How large is our government budget deficit? CBO reports a total deficit of $1.7T (5.4% of GDP) and a primary deficit of $1T (3% of GDP). The CBO and International Monetary Fund assert that, in the words of the CBO, “The primary deficit is a better indicator of the long-term sustainability of government debt than the total deficit because it excludes the cost of debt service, which is affected by past borrowing decisions and interest rates.”8
Don’t believe them. Listen instead to the US Treasury. Regardless of whether debt service costs are a function of “past borrowing decisions and interest rates,” it’s still government spending. Even assuming a stable primary deficit of 3% of GDP and stable non-interest spending of 23% of GDP, according to our US Treasury, under present fiscal policy, interest expense will drive total federal government spending from 23% now toward 35% in 2050 and 50% by the end of the century. As the US Treasury tells us, supported by the charts below, our current fiscal path is unsustainable9.
What Amount of Deficit Spending is Sustainable?
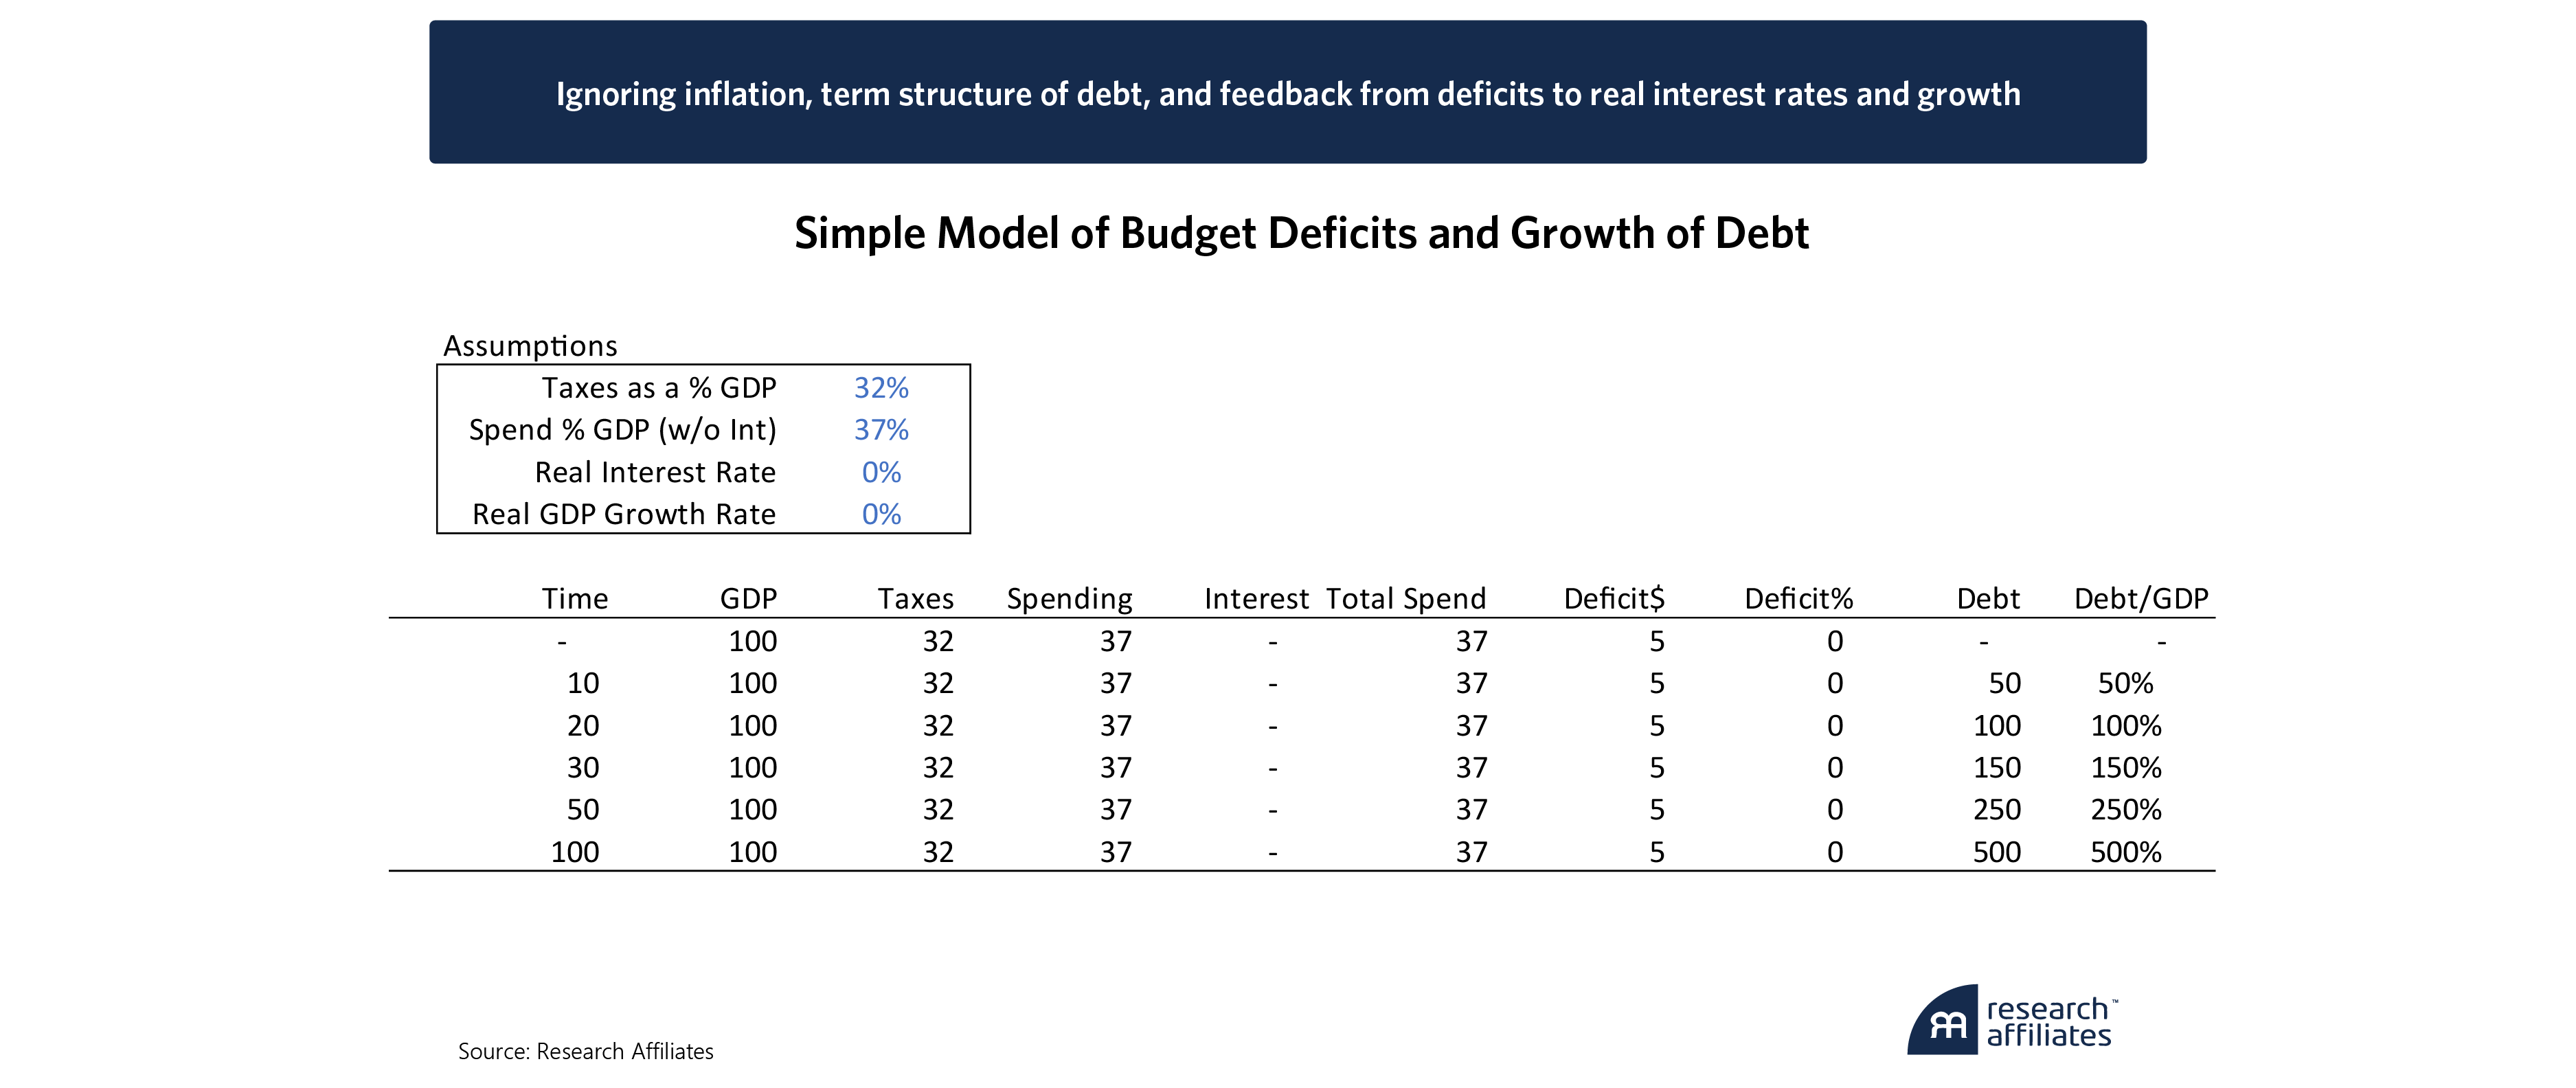
My simple and intuitive model of government debt illustrates the dynamic relationship between growth and interest rates that determines the theoretical sustainability of government deficits. Starting from zero debt, and ignoring growth and interest rates, 5% annual deficits will produce a debt equal to 100% of GDP in 20 years and 500% of GDP in 100 years, clearly unsustainable.
If, however, growth significantly exceeds the rate of interest, then deficits can be sustained. As a rule of thumb, deficits as a percentage of GDP are sustainable at the difference between real GDP growth and the real rate of interest on government debt. In other words, if real GDP growth exceeds the real interest cost of debt by 2% or 5%, then a government may sustainably incur 2% or 5% budget deficits, respectively.
Looking at US history, with real GDP growth of nearly 5% from WWII to 1980 (nearly equal parts population and productivity growth), budget deficits of only about 2% of GDP, and real interest rates of approximately 2%, our simple model of debt rises from zero to only 30% of GDP in 20 years and just over 60% in 100 years.
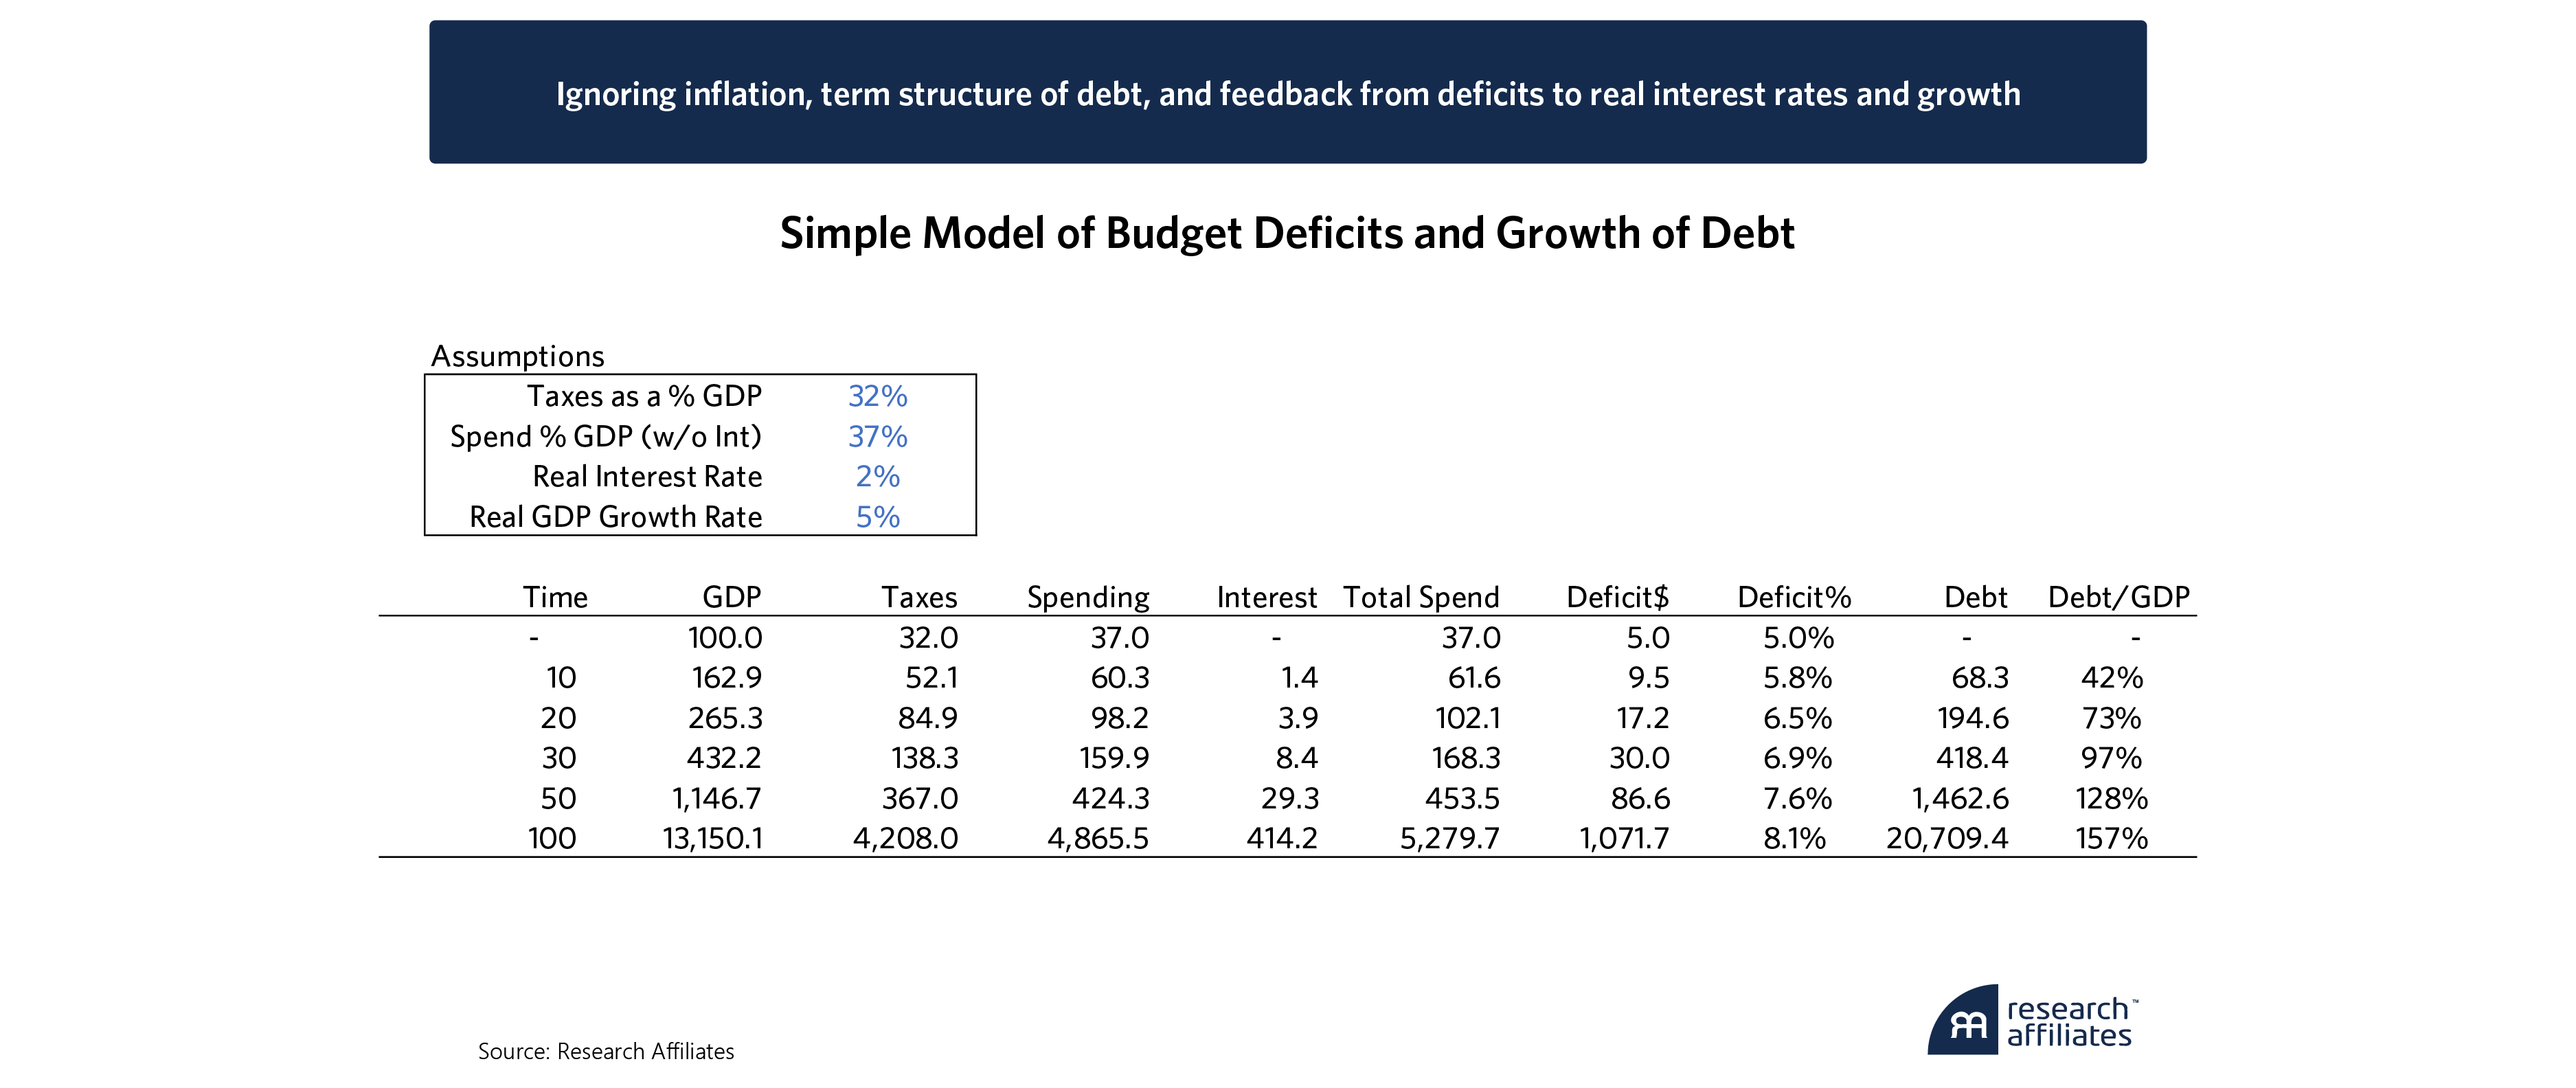
When we raise deficits to 5% of GDP, as we have over recent years, and keep growth at 5% and real interest rates at 2%, then modeled debt rises from zero to 100% in 30 years and 160% in 100 years.
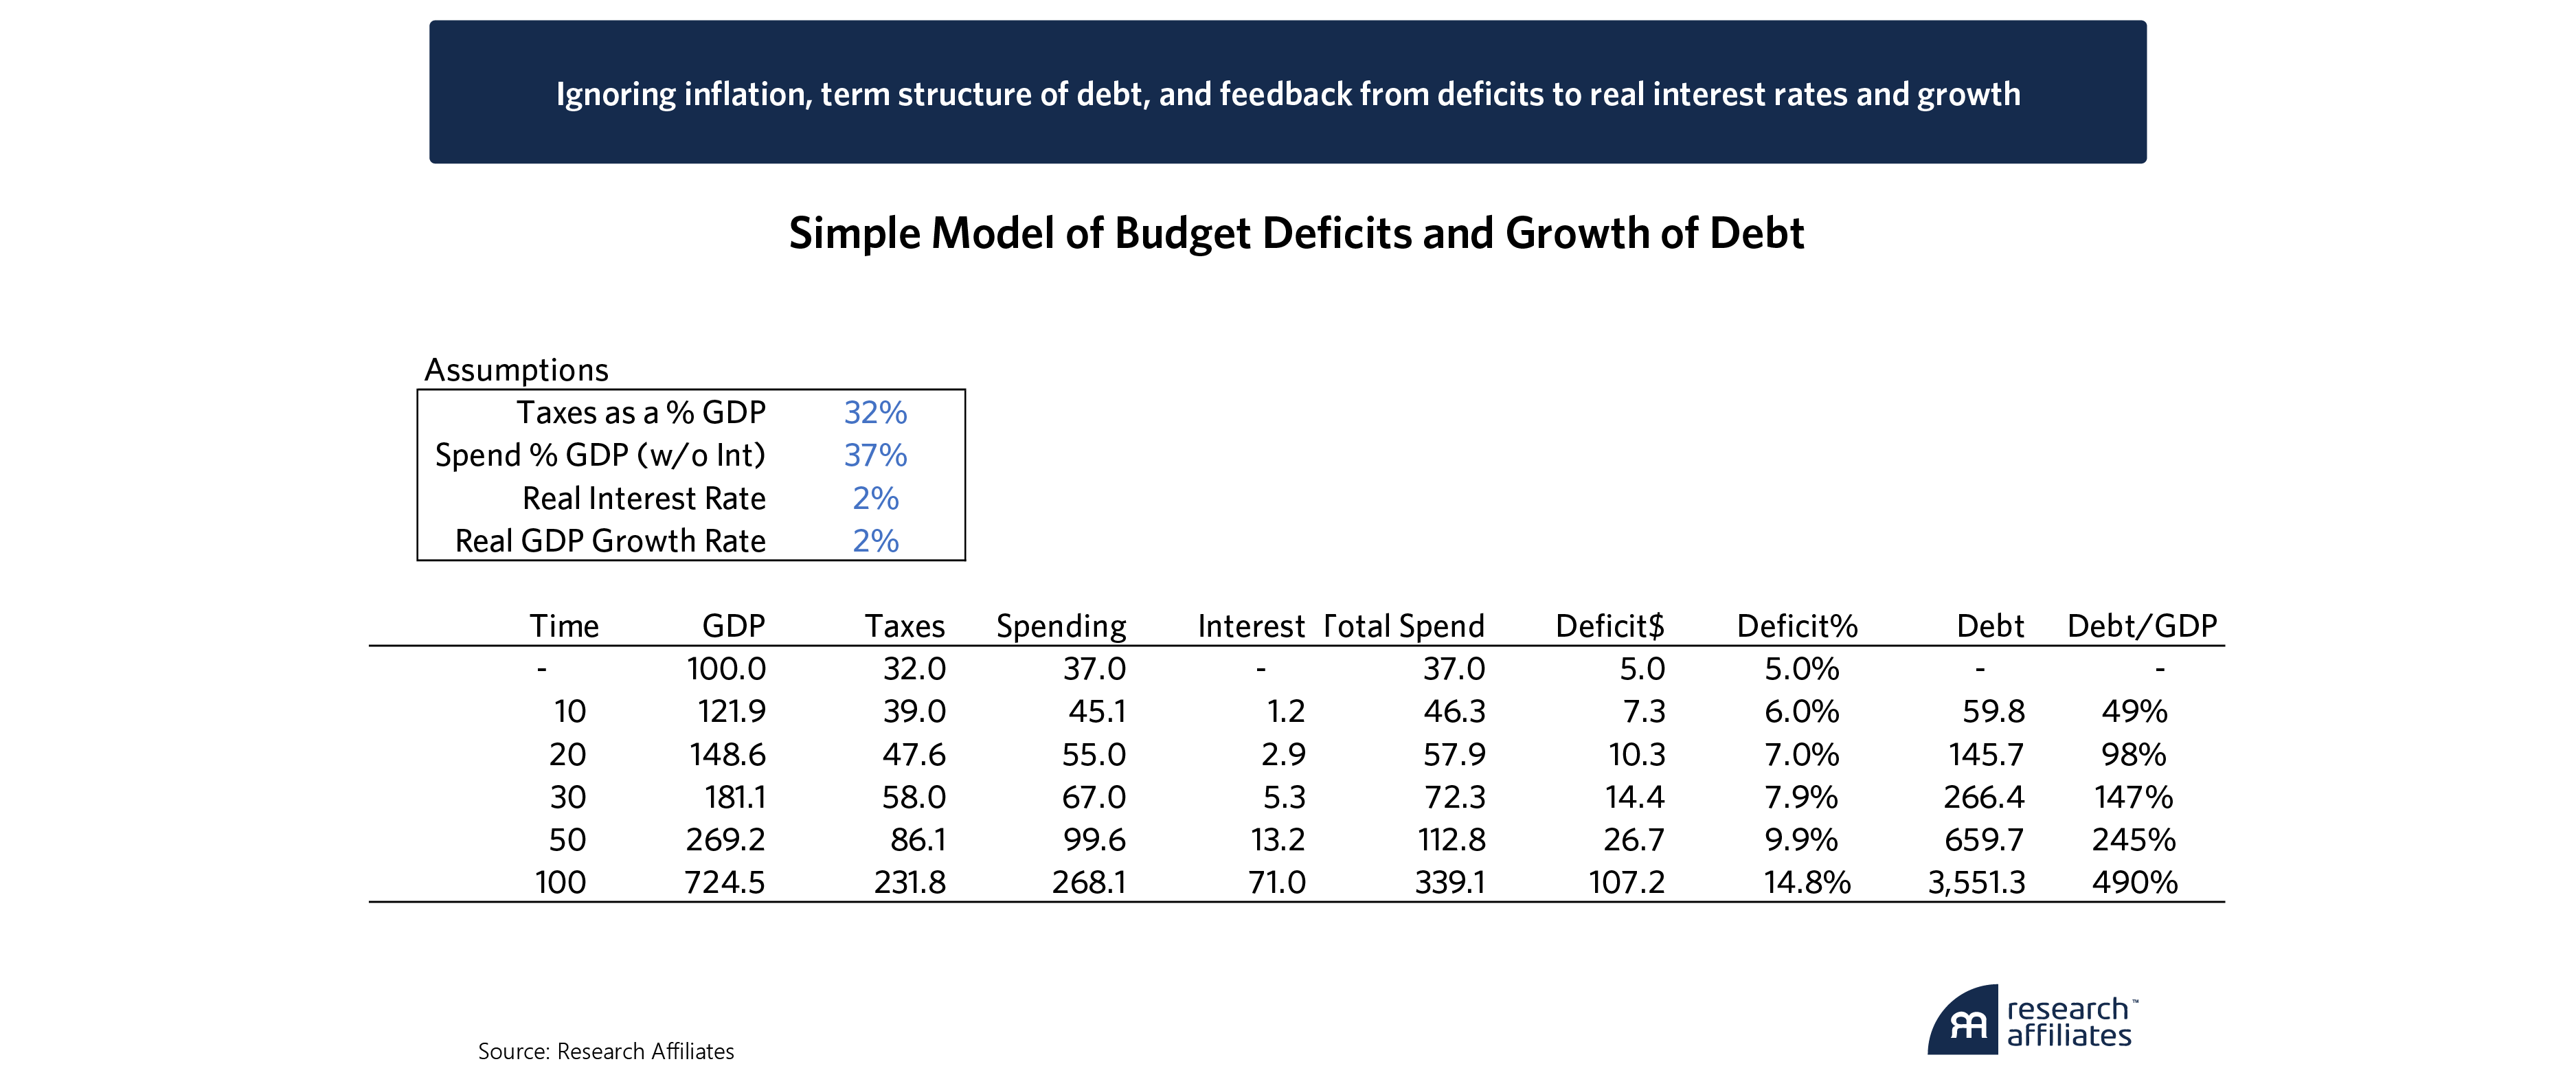
Keeping deficits at today’s 5% of GDP and lowering growth to 2% (0.5% population growth and 1.5% productivity growth as CBO and Treasury forecast) with a 2% real rate of interest produces modeled debt rocketing up from zero to nearly 100% of GDP in just 20 years, to nearly 250% of GDP in 50 years and almost 500% in 100 years.
Reality in such a scenario would be much worse. As John Cochrane explains, the fiscal theory of the price level10 shows us that fiscal policy ultimately determines the price level, meaning inflation. Unlike our simple model, rising debt levels would, at some point, increase inflation and interest rates as well as depress real growth, thus worsening deficits and growth of the debt. To repeat, the current fiscal path is unsustainable.
Will We Do What’s Right?
On January 12, the Financial Times’ Lauren Fedor chatted with former House Speaker Keven McCarthy over lunch on Capitol Hill. She asked, “What if voters only elect more agitators in the future?” McCarthy replied, “What if? What if? In the end, I always trust the voters. Winston Churchill said you can always count on an American to do what’s right after they have exhausted every other option. We’re just exhausting our options.”
Please read our disclosures concurrent with this publication: https://www.researchaffiliates.com/legal/disclosures#investment-adviser-disclosure-and-disclaimers.

Endnotes
- Treasury called the fiscal path unsustainable in its latest fiscal year analysis. Executive Summary to the Fiscal Year 2022 Financial Report of U.S. - An Unsustainable Fiscal Path (fiscal.treasury.gov)
- Thoughts from the Front Line, “No Way Out” January 12, 2024. (mauldineconomics.com)
- Phelps, Edmund S., Mass Flourishing, March 2015. (Princeton University Press)
- U.S. National Debt Clock: Real Time (usdebtclock.org)
- The Budget and Economic Outlook: 2023 to 2033 | Congressional Budget Office (cbo.gov)
- Q&A: Gross Debt Versus Debt Held by the Public | Committee for a Responsible Federal Budget (crfb.org)
- Gross Domestic Product, Third Quarter 2023 (Advance Estimate) | U.S. Bureau of Economic Analysis (BEA)
- The 2023 Long-Term Budget Outlook | Congressional Budget Office (cbo.gov)
- Executive Summary to the Fiscal Year 2022 Financial Report of U.S. Government (fiscal.treasury.gov)
- Cochrane, John H., The Fiscal Theory of the Price Level, January 2023. (Princeton University Press)
