
Stocks generally move upward over time, but periodic bouts of volatility like the recent market correction can cause investors stress and lead to panic selling.
Fundamentals drive long-term equity performance. Even with higher interest rates, markets are not particularly overextended from a valuation, earnings or sentiment perspective.
Concentration of capitalization weighted indexes is at an all-time high, leading to concern about performance being dependent on a handful of mega cap growth companies. Equal or fundamentally weighted indexes remove concentration risk while allowing for diversified market participation.
Trench warfare in the early 20th century has been described as long periods of boredom punctuated by moments of terror. In many ways, investing in the stock market is similar. Most of the time, stocks move generally upward in a slightly erratic manner. Occasionally, a bear market takes hold, destroying wealth and wreaking havoc in investor portfolios. Investors fret, and the financial media spins into overtime covering the market crash. The stock market in 2023 has followed something of this pattern.
Create your free account or log in to keep reading.
Register or Log in
The feel-good equity rally of 2023 melted away in the scorching summer days of July. Since its peak on July 31, the S&P 500 Index fell over 11% through October 30, entering a correction defined as a decline of 10% Strategists began debating another bear market. On Halloween, the Treasury gave the bond market a treat by showing restraint in long dated issuance plans. In the days that followed, milder than expected economic data rolled in, leading both bond and equity markets to rally sharply.
The S&P 500 recovered over half of its drawdown by the end of the week and has rallied nearly 10% over the three weeks since its latest trough. VIX, the fear gauge, dropped as demand for protection subsided, and the 10-year Treasury yield fell over 40 basis points.
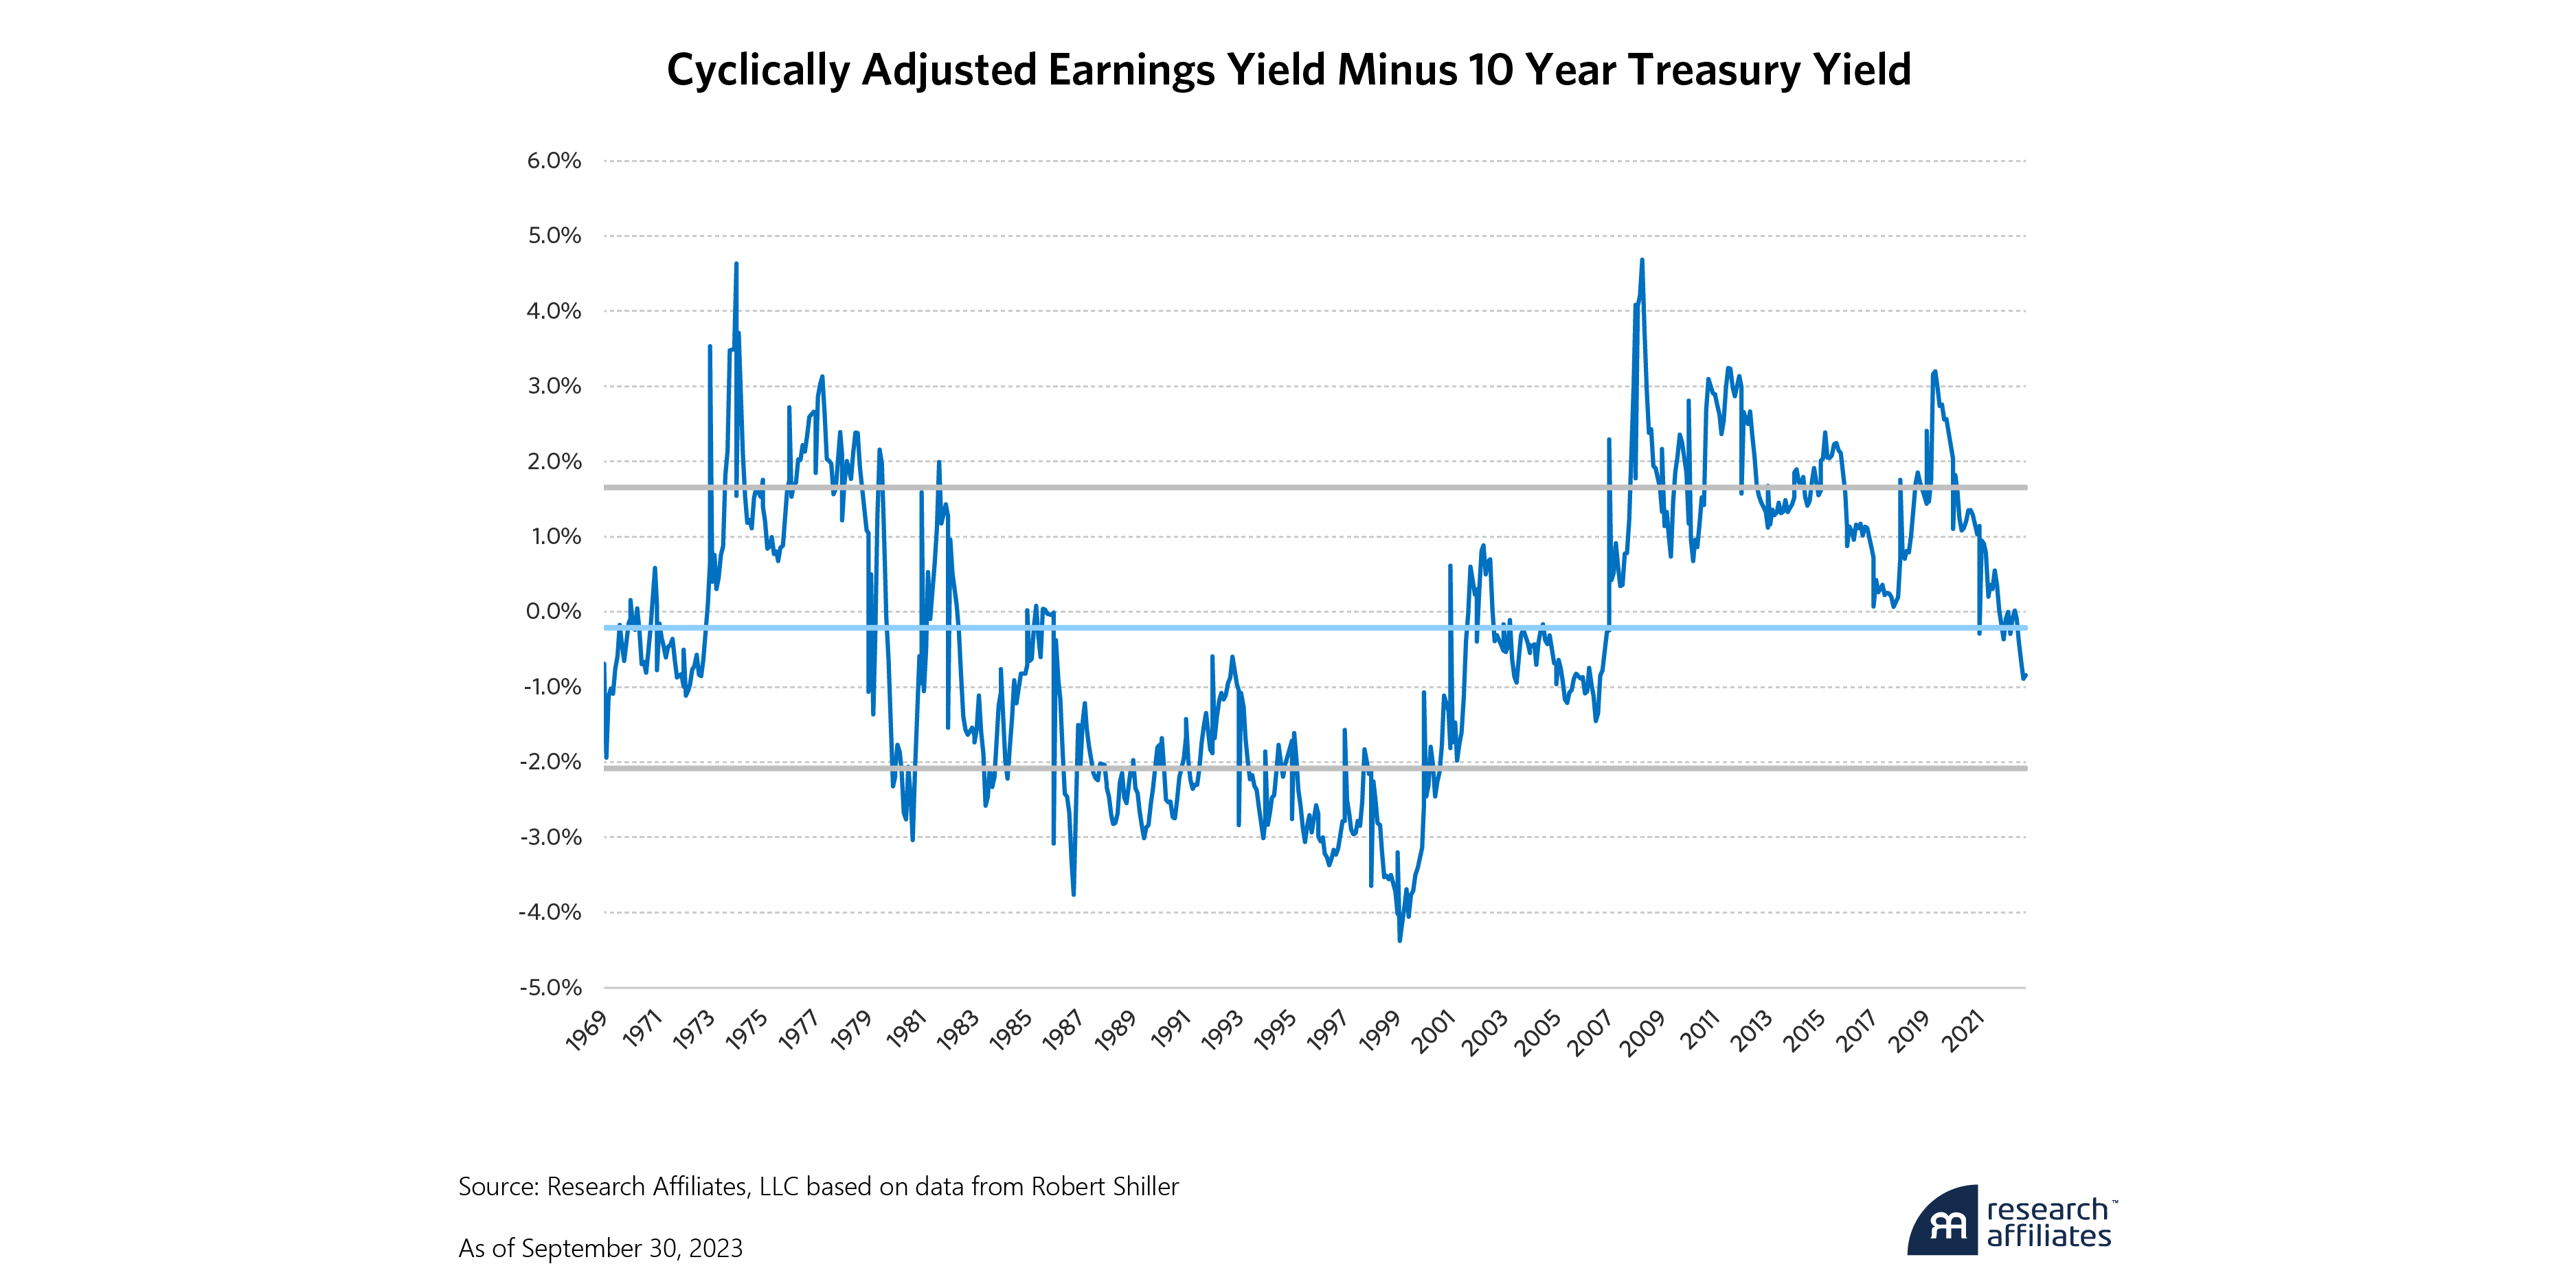
Market valuations can remain modestly imbalanced relative to bond yields for long periods of time.
”Now, several strategists have warned that the pop in previously oversold markets is merely a bear market rally. Inflation remains higher than comfortable, ensuring that interest rates will also remain higher. Meanwhile, earnings growth seems mediocre, highlighted by Tesla’s big miss. The dangerous combination of higher cost of capital and constricted growth can only mean renewed downside for equities, according to these prognosticators.
As investors, we must acknowledge that anything can happen in the short term. However, in the long term, fundamentals drive markets, and an examination of fundamentals paint a modest, ho-hum picture for equities neither being overextended nor outright cheap. In evaluating the markets, we focus on three types of equity fundamentals: valuation, which measures how much optimism is already priced into markets, earnings, which measures whether companies are delivering growth to investors, and sentiment, which measures whether there is extreme positioning in markets that could suddenly reverse.
Valuation
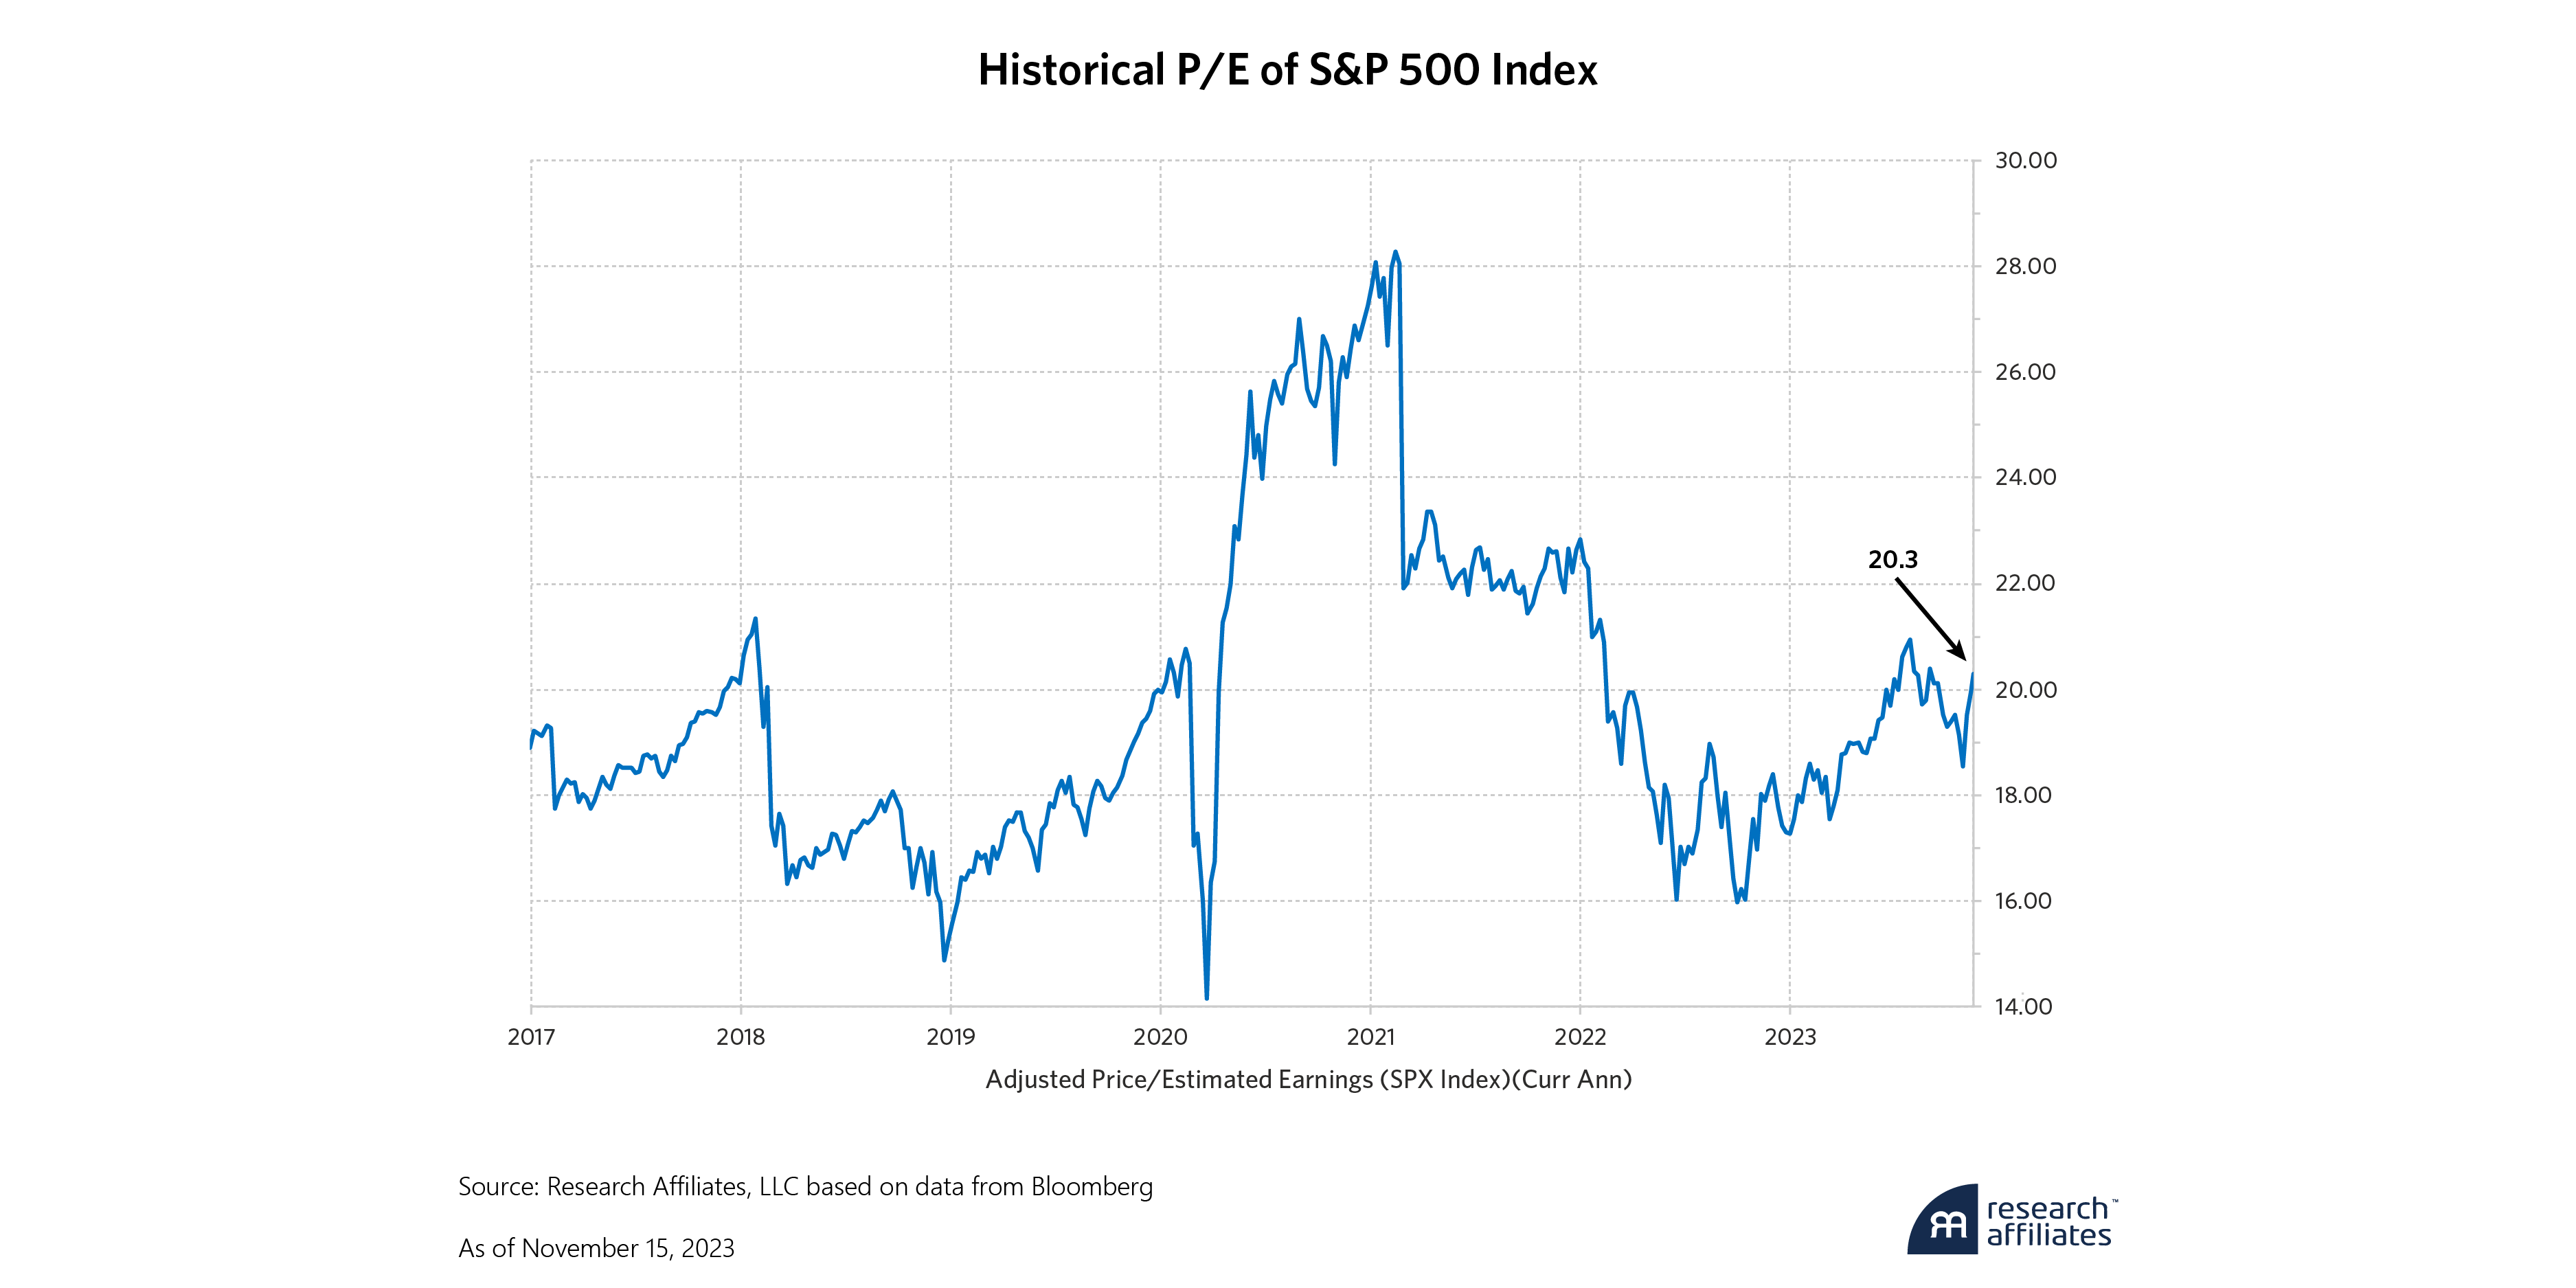
The forward P/E of the S&P 500 is just under 20x as of this writing. The chart below shows the P/E of the S&P 500 over the past seven years. The current level of 19.7x is at the average over this time period, and slightly above the median of 18.8x. While it is difficult to argue that equities are cheap, they also do not appear to be overvalued.
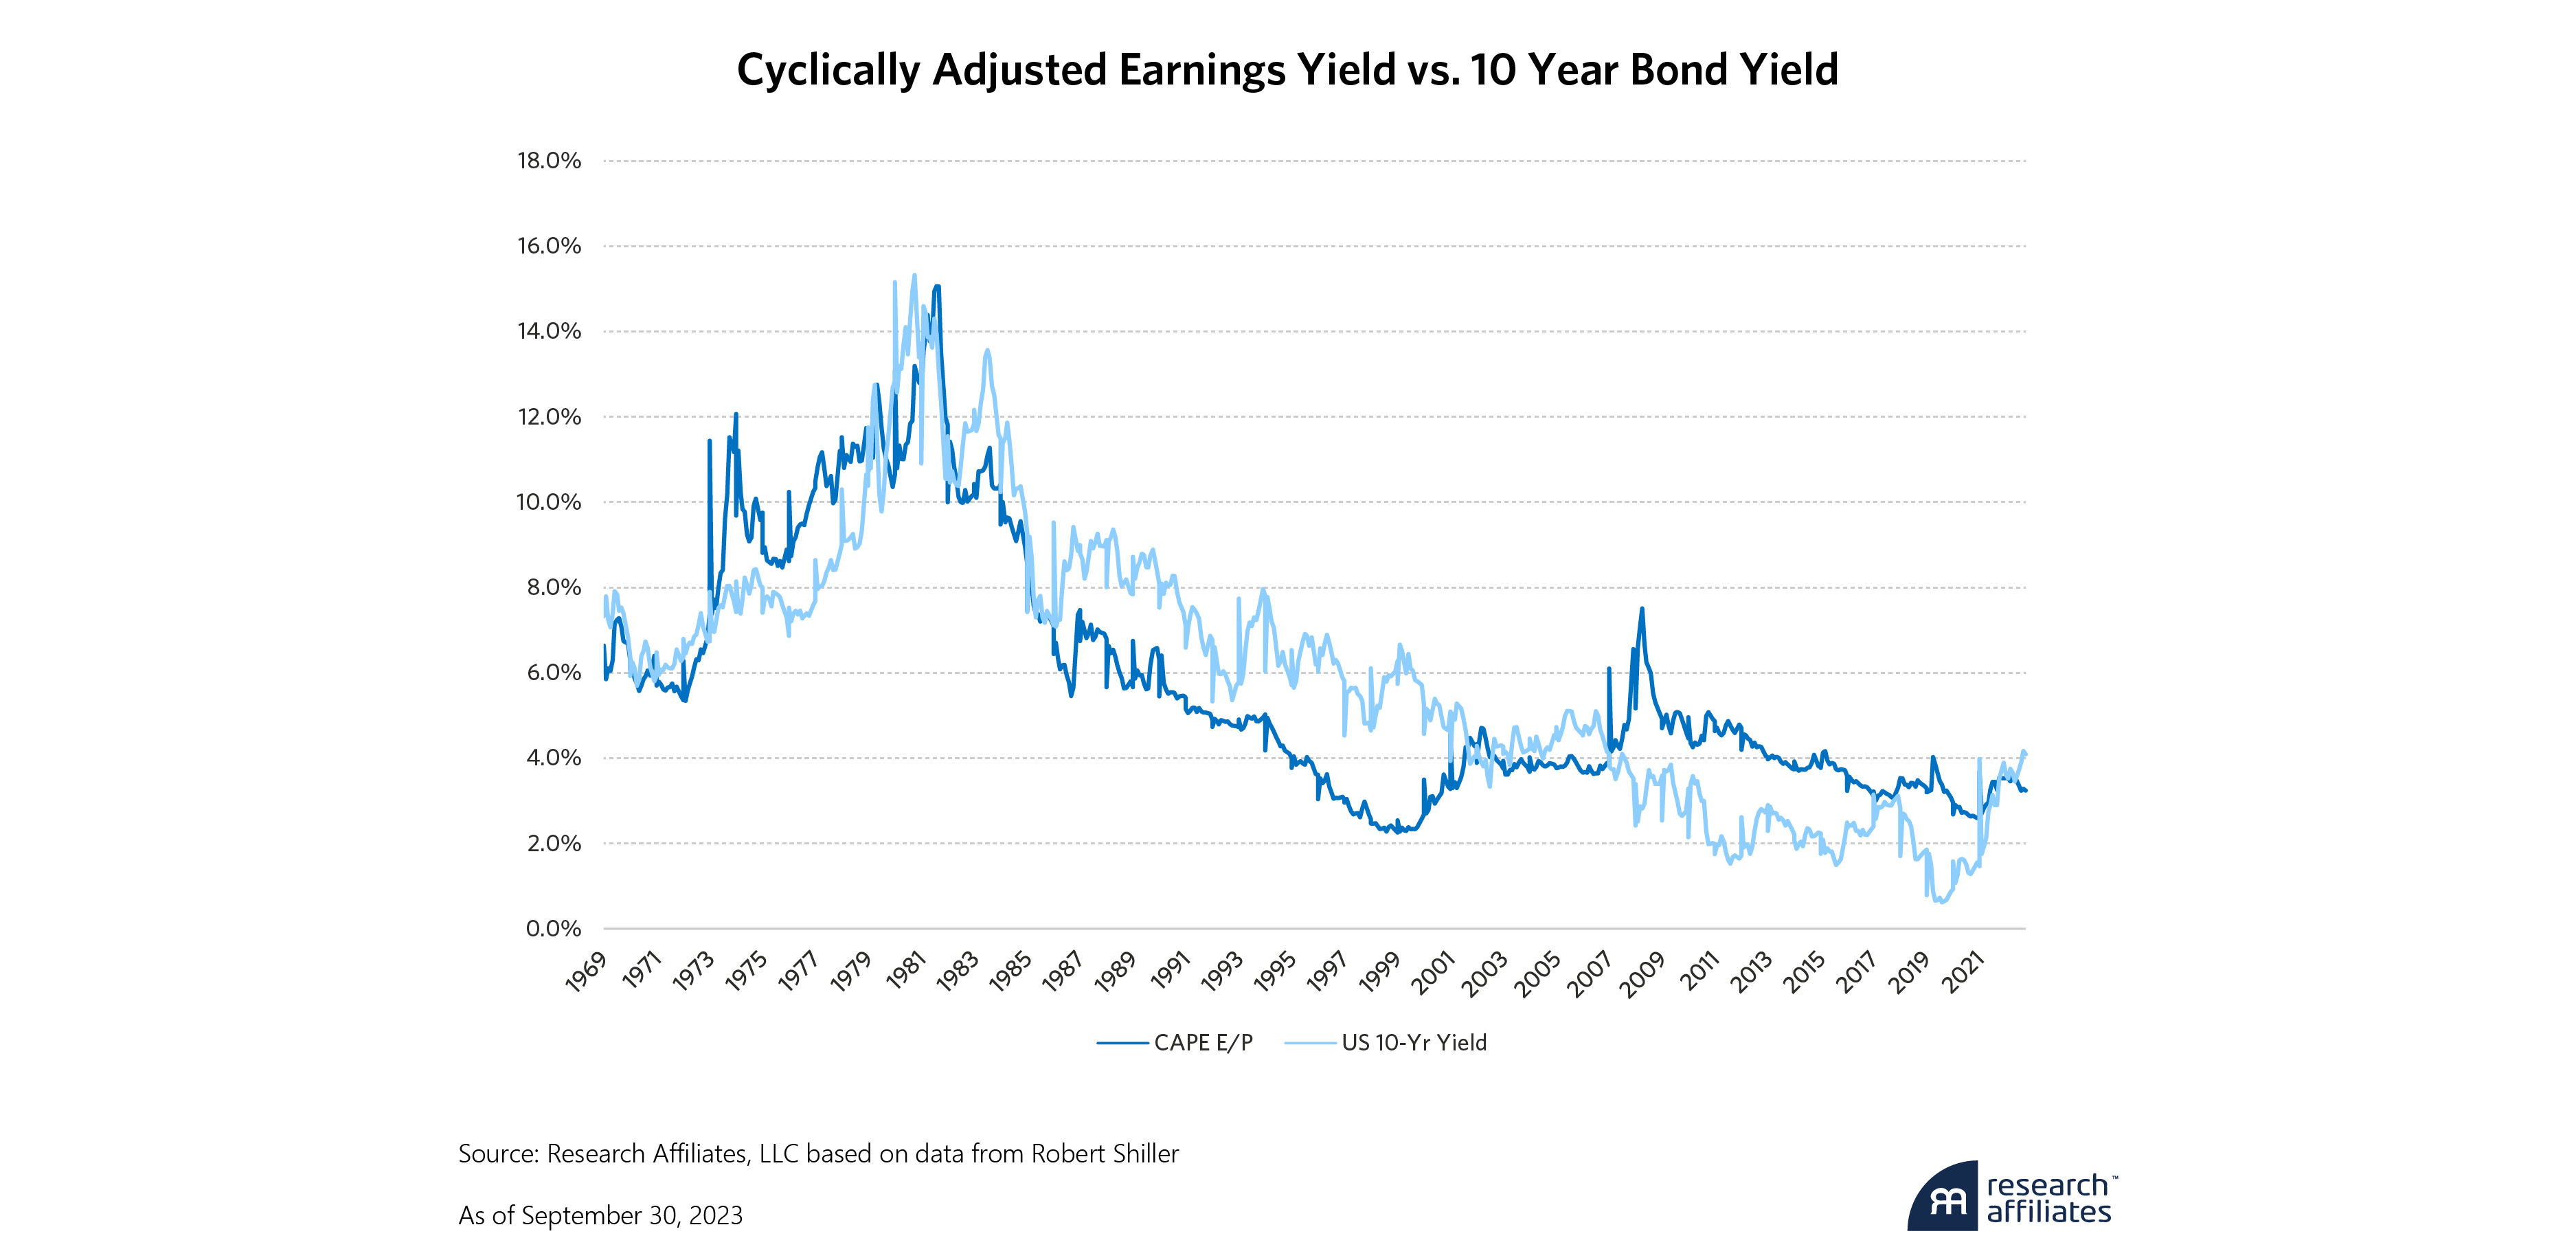
Bears will argue that today’s interest rate environment is far more restrictive than pre-pandemic times, and comparing valuations through time requires a cost of capital adjustment. While there are many ways of modeling the impact of higher rates, a quick method is the classic Fed Model coined by Ed Yardeni1. This model compares the earnings-to-price of the equity market, known as the earnings yield, to the current 10-year Treasury yield. When the gap is positive, equities are cheap. When it is negative, equities are expensive.
On the chart below, we take a slightly nuanced approach to this concept by comparing the cyclically adjusted earnings yield to the 10-year Treasury yield. This relationship between earnings yield and the 10-year yield has been highly correlated for several decades.2 In using cyclically adjusted earnings and subtracting the 10-year bond yield, we create an indicator that focuses on longer term opportunities and risks rather than short-term fluctuations. The peaks and valleys of this indicator are easily identifiable with memorable market events, including the start of the bull market in 1982, the peak of the dot-com bubble in 1999, the Lehman moment of 2008, and the COVID crash and recovery of 2020. What is often missed is that market valuations can remain modestly imbalanced relative to bond yields for long periods of time. Currently, the cyclically adjusted earnings yield is slightly less than the 10-year bond yield. The gap is miniscule relative to its historical range. While this implies that equities are not cheap, there is also no obvious over-valuation alarm at this time.
Earnings
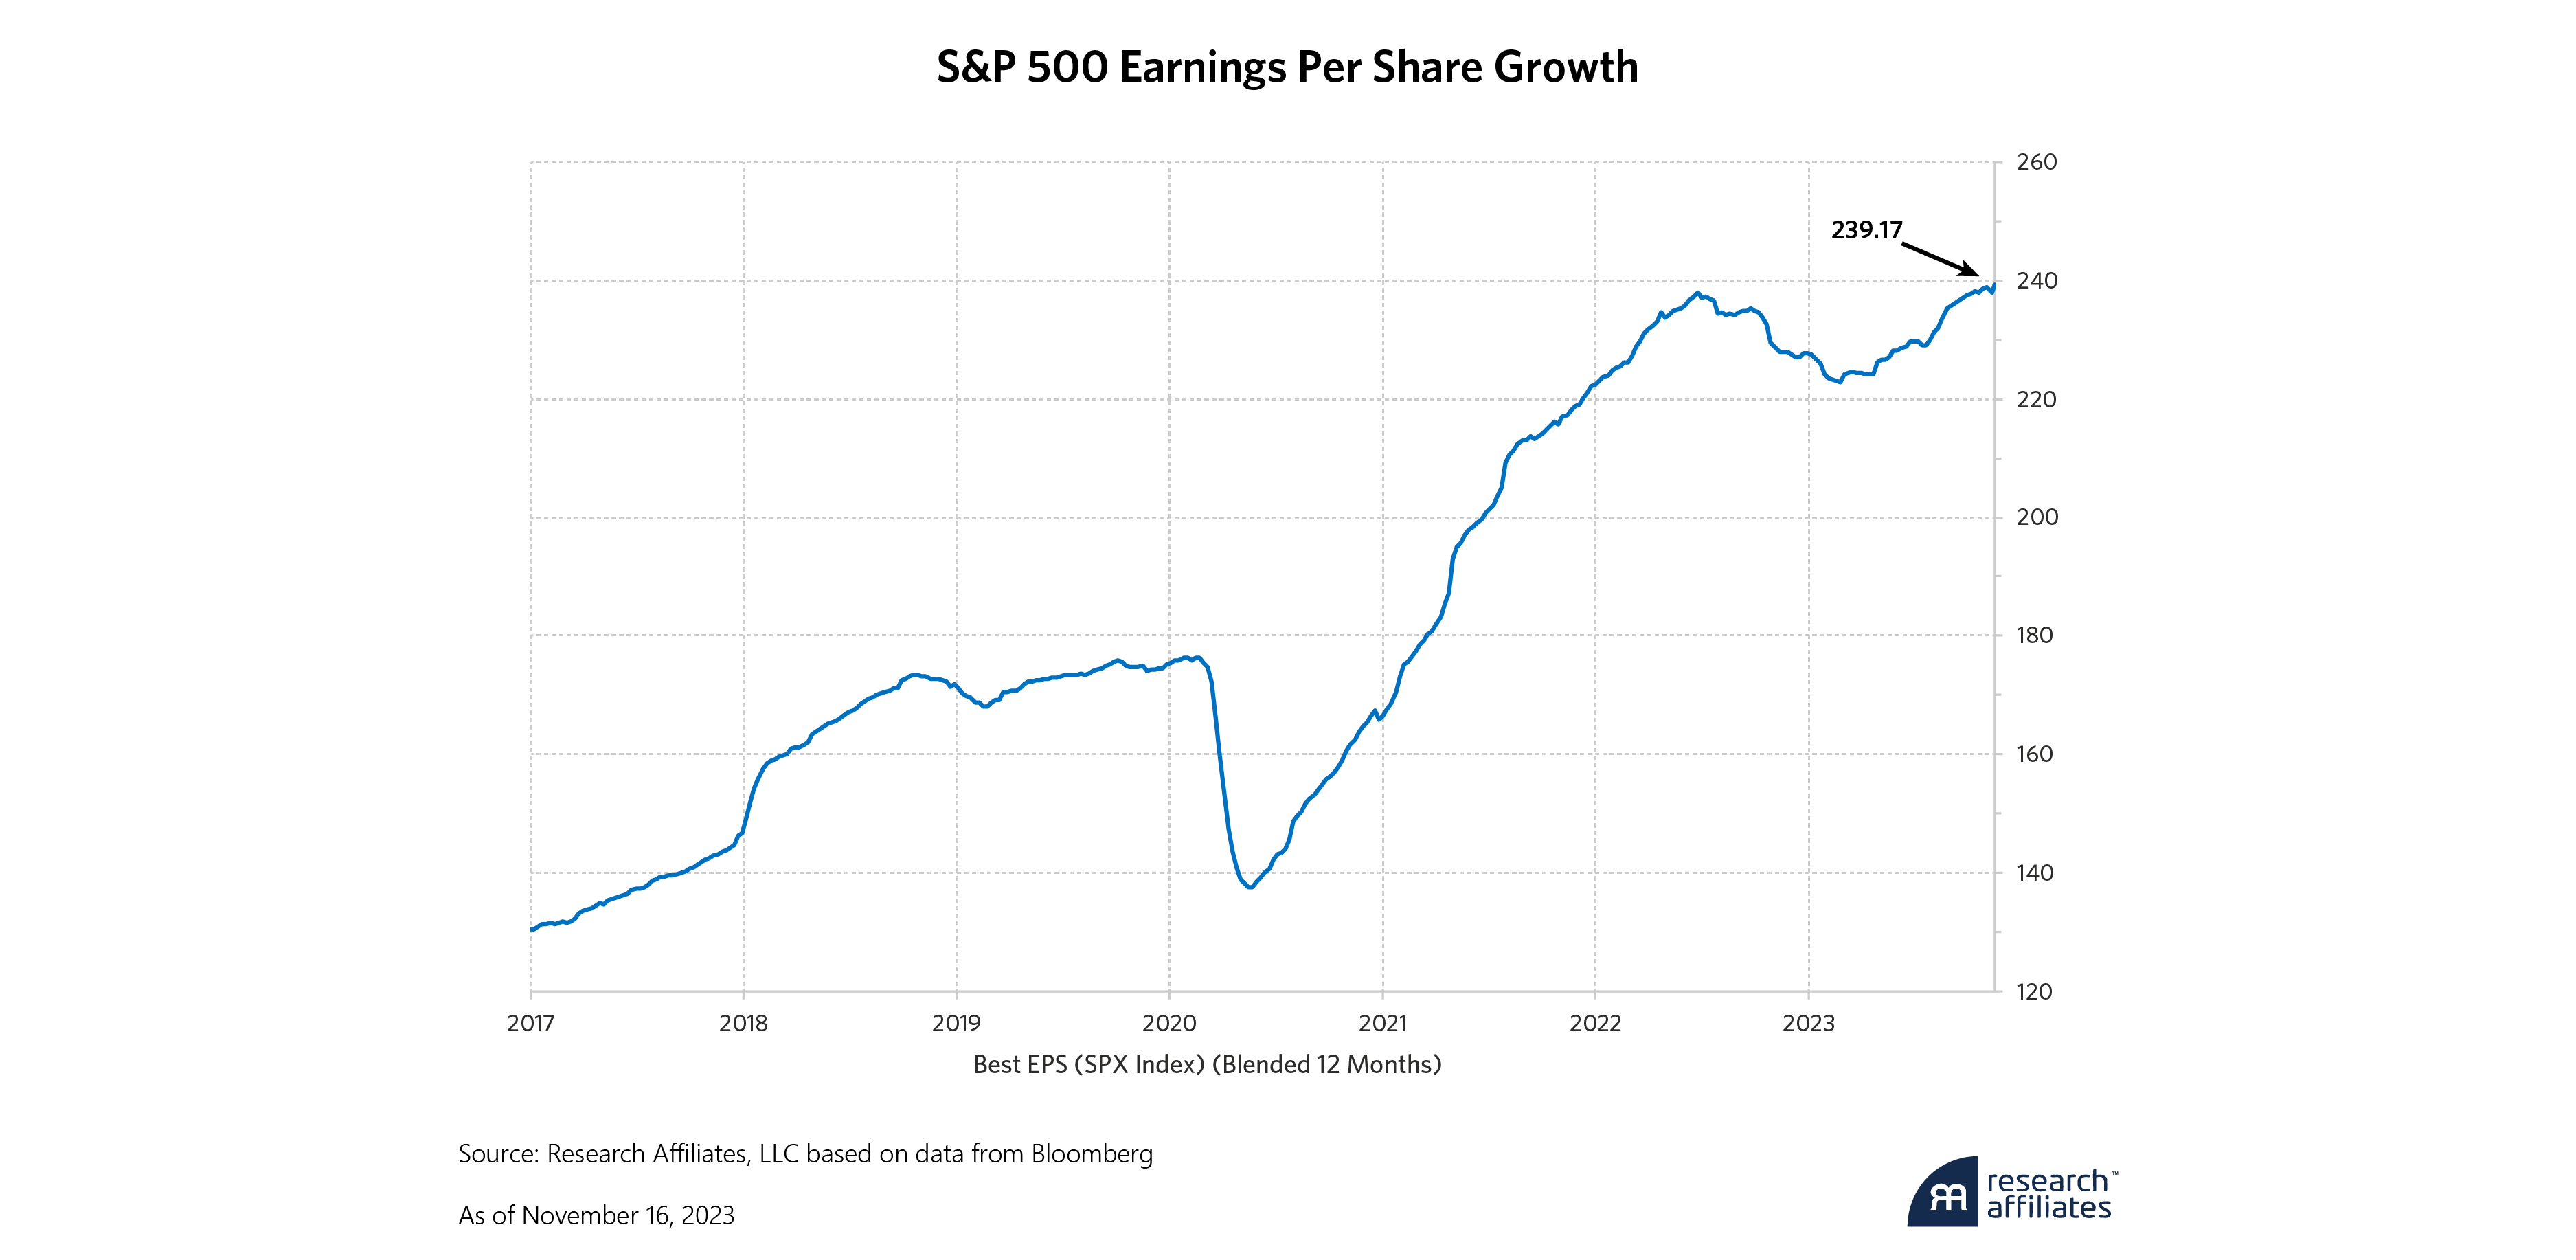
Some high-profile earnings blemishes this quarter have caused investors to fret. Tesla’s outright miss wiped $130 billion off the value of the company over the next three days. Google and Apple beat expectations, but underlying business fundamentals and guidance were imperfect. Both stocks suffered price declines in the aftermath. However, looking at earnings in totality paints a fairly stable picture. After slowing in 2022, earnings growth resumed this year. Analyst expectations for next year’s growth in S&P 500 earnings is 10-12%. While this pace of growth pales in comparison to the 40% growth in the first year out of the pandemic, it is far from dire.
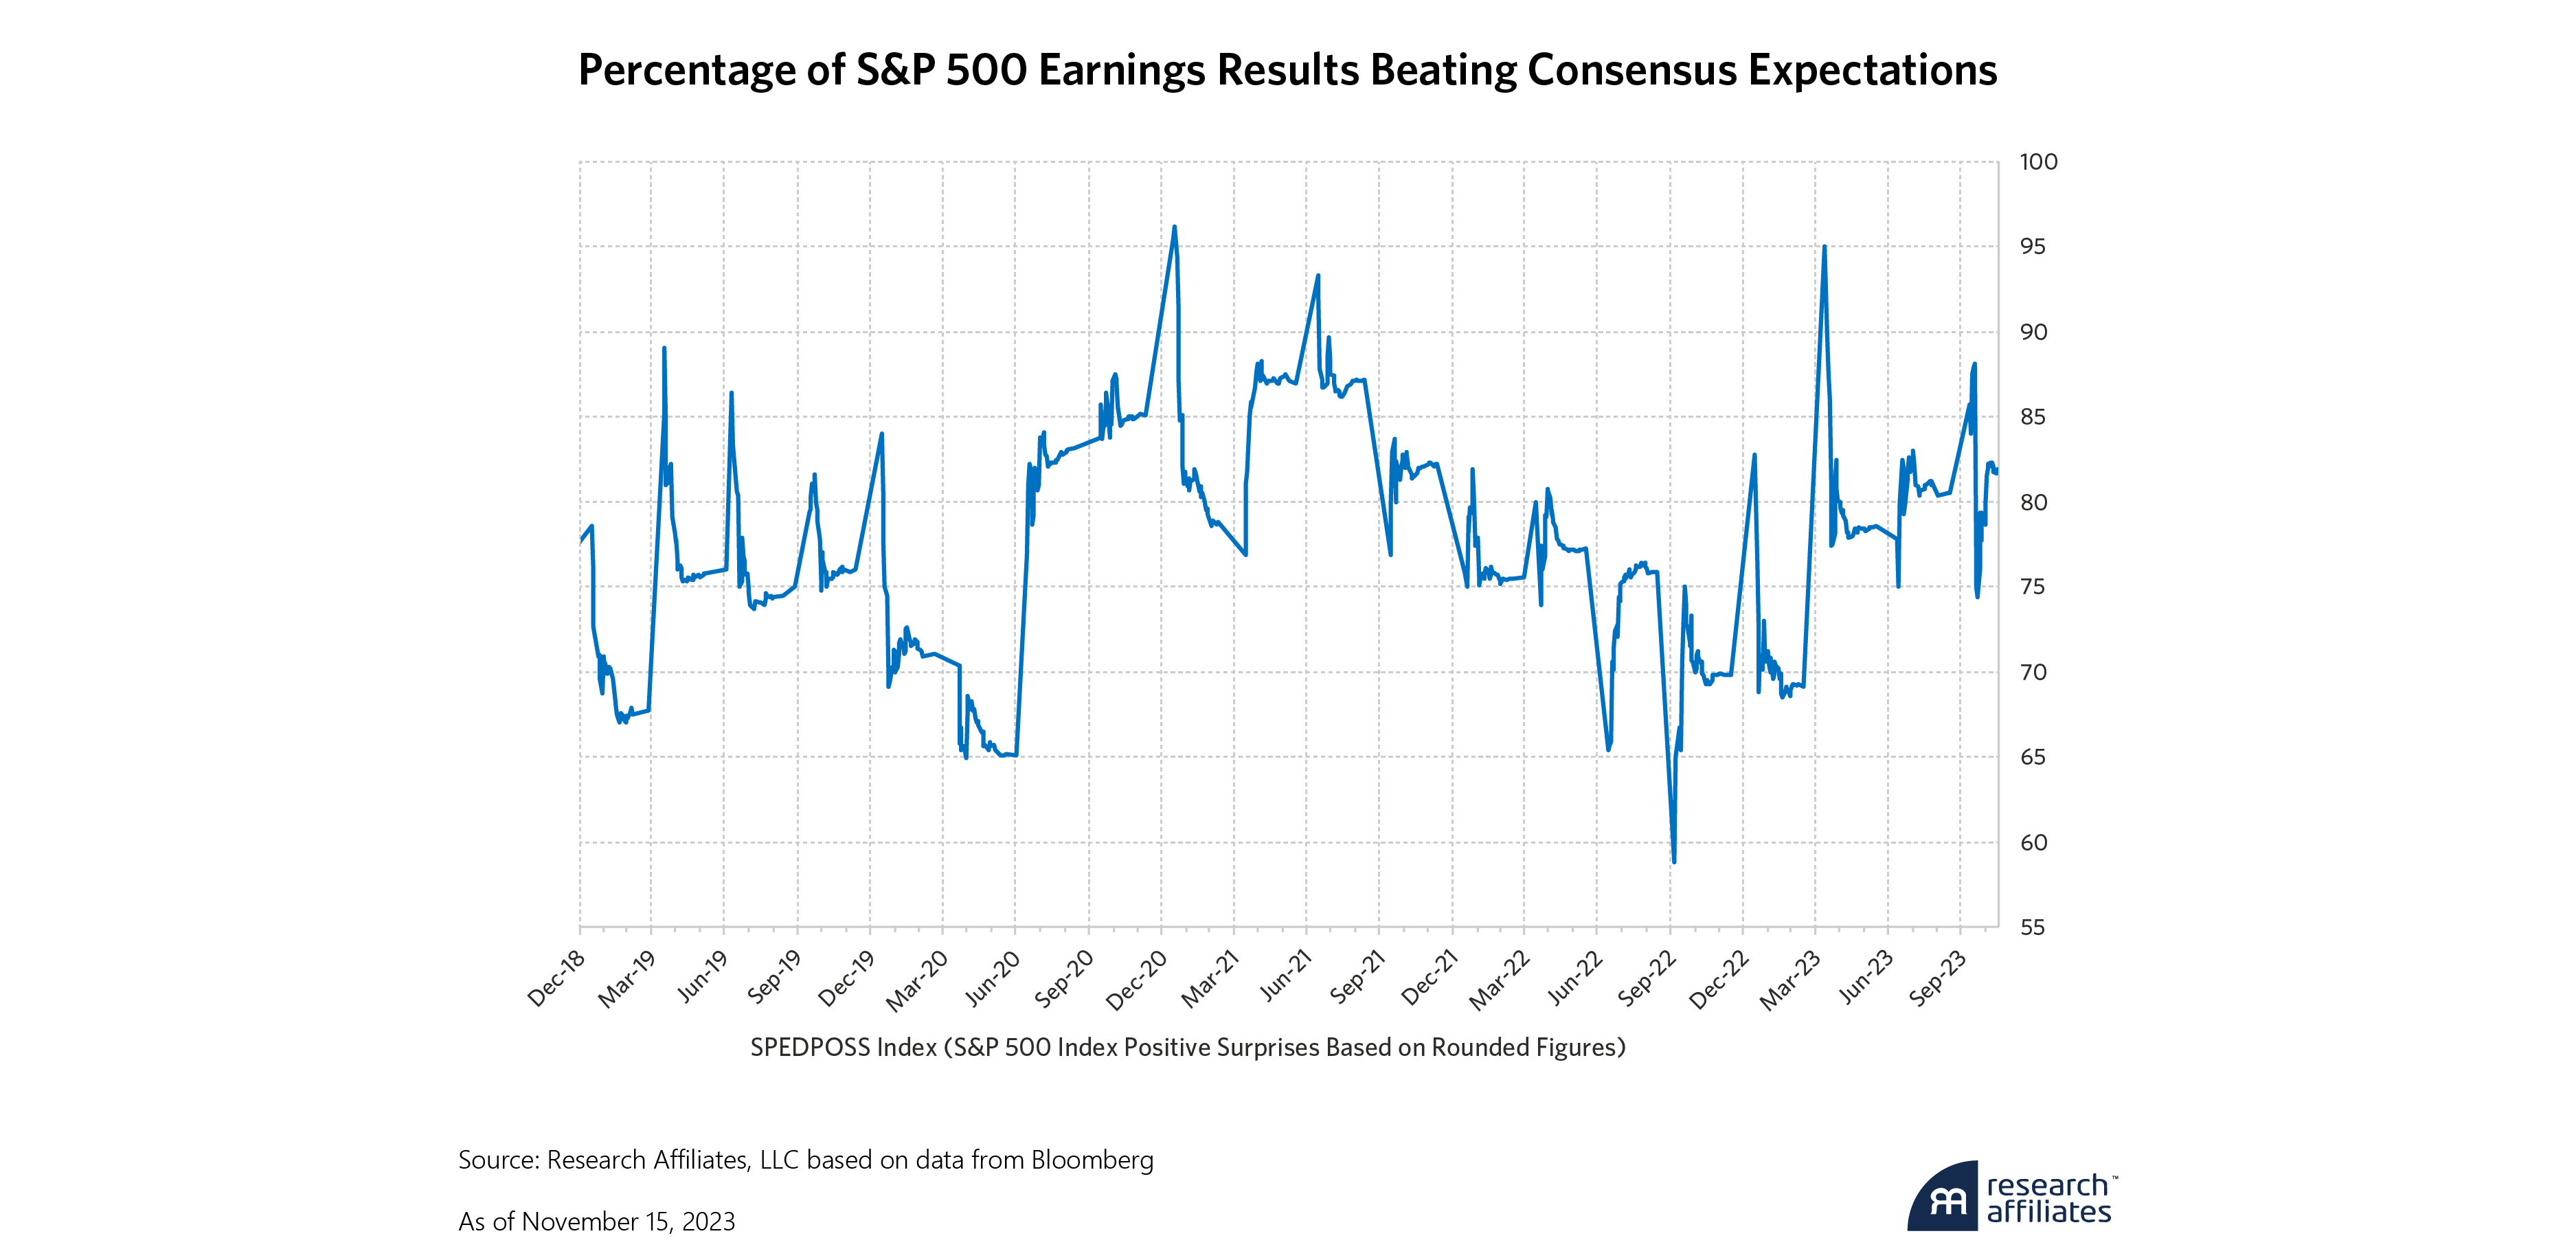
Furthermore, growth expectations should already be discounted in the market, and the ongoing dynamics should surround whether or not companies are meeting or missing these expectations. Despite the high-profile hiccups noted above, data shows that earnings announcements remain strong relative to expectations. The chart below graphs the percentage of reported earnings above analyst consensus estimates. Over the past five years, approximately 75% of earnings announcements have exceeded analyst consensus on average. This high ratio of beats showed that CFOs successfully managed analyst expectations down and EPS up. Currently 82% of S&P companies are beating expectations – hardly cause for disappointment. From this angle, discerning a reason to worry about earnings is difficult.
Sentiment
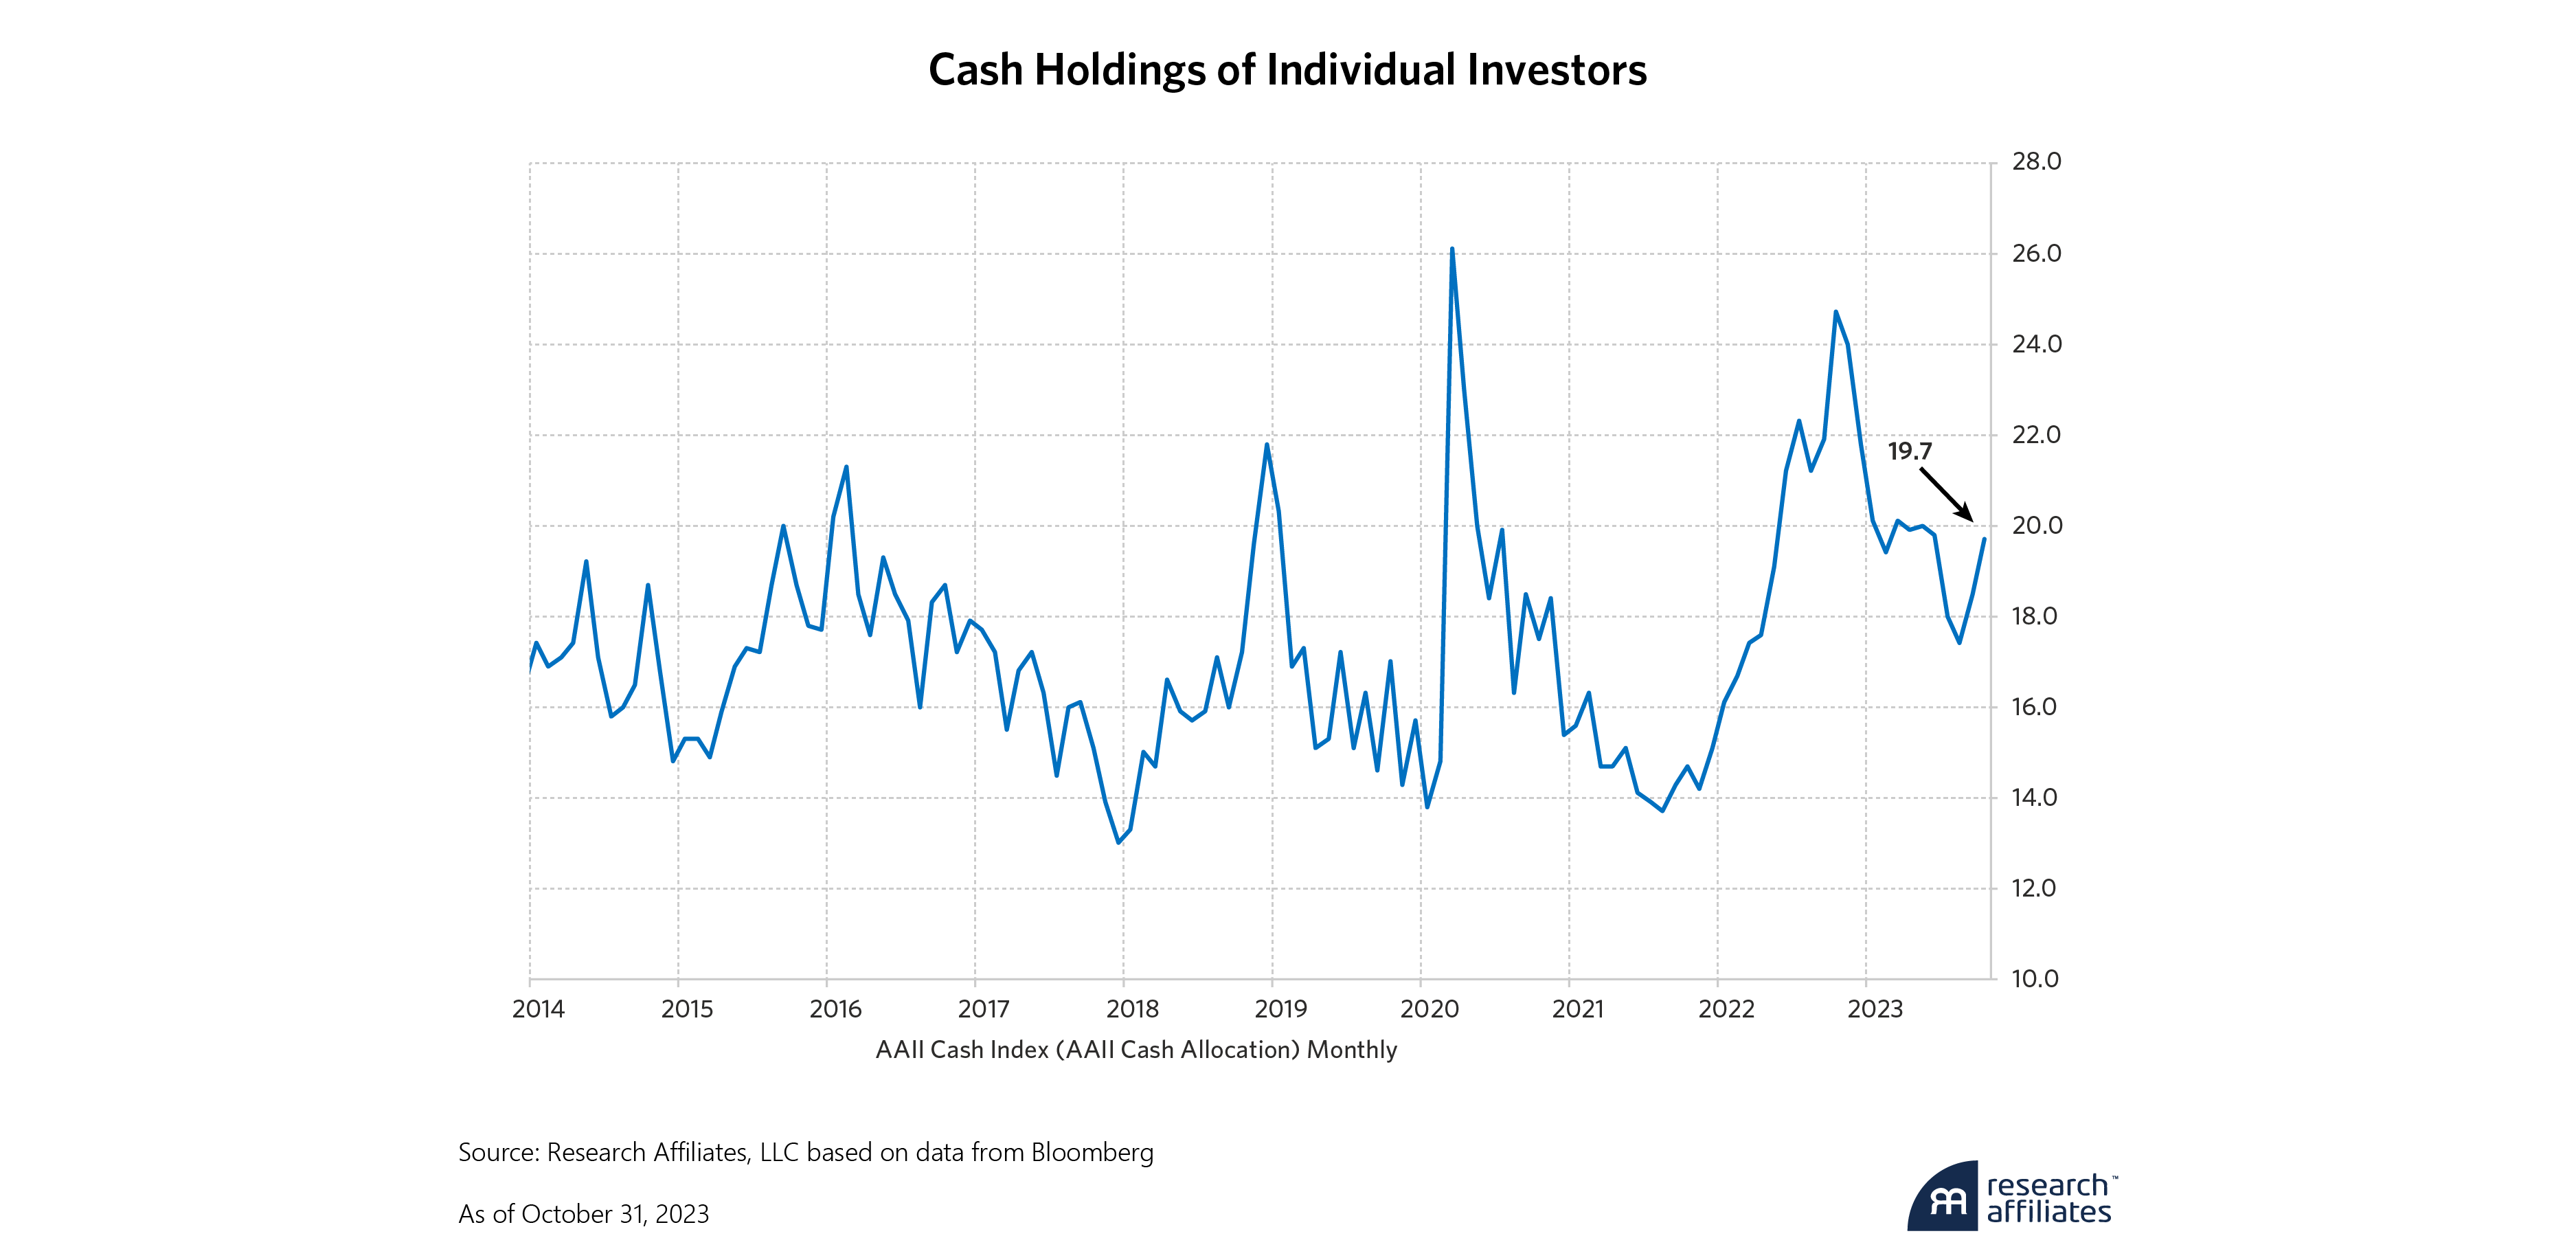
Market sentiment is most frequently used as a contrarian indicator. The most famous example of this is Warren Buffett’s quote that one should be “fearful when others are greedy and greedy when others are fearful.” A useful metric of fear is the cash positioning of individual investors by the American Association of Individual Investors3. Though the monthly survey is subject to a one-month lag, it still provides a gauge of available liquidity for investors. The chart below shows that as of early October, investors held almost 20% of their portfolios in cash, compared with the past 10 years average of ~17%. The chart also shows that cash tends to rise during periods of equity market stress only to fall as investors rebalance into equities at favorable levels. The chart also shows low cash levels coincide with the beginnings of difficult equity market performance (early 2018, early 2020, early 2022). The current level of almost 20% gives investors room to buy more risk assets and does not portray an overbought market on the part of individual investors. At the same time, it does not portray a high level of fear or bearishness, which was seen in the pandemic crash of 2020 and at the end of 2022. Like valuations and earnings, the sentiment indicator portrays a balanced equity market that is neither overextended nor brimming with upside potential.
Why all the fuss?
Current equity fundamentals appear to be in normal territory. Of course, a shock could jolt the market from its comfort zone. Examples most often include liquidity crises or geopolitical conflict. Short of these outlier events, equity markets tend to rise in normal times, an expected and good outcome for long-term investors. But if fundamentals are in “normal” territory, why has there been so much fuss about the market recently?
One possibility is that a 10% correction in markets starts to make investors nervous. However, equities are volatile, and 10% corrections have occurred in five of the last 10 years, though equities have risen over this time period. A 10% correction is a fairly normal occurrence, even though it creates discomfort. Historically, buying equities after a 10% correction has been more profitable than selling.
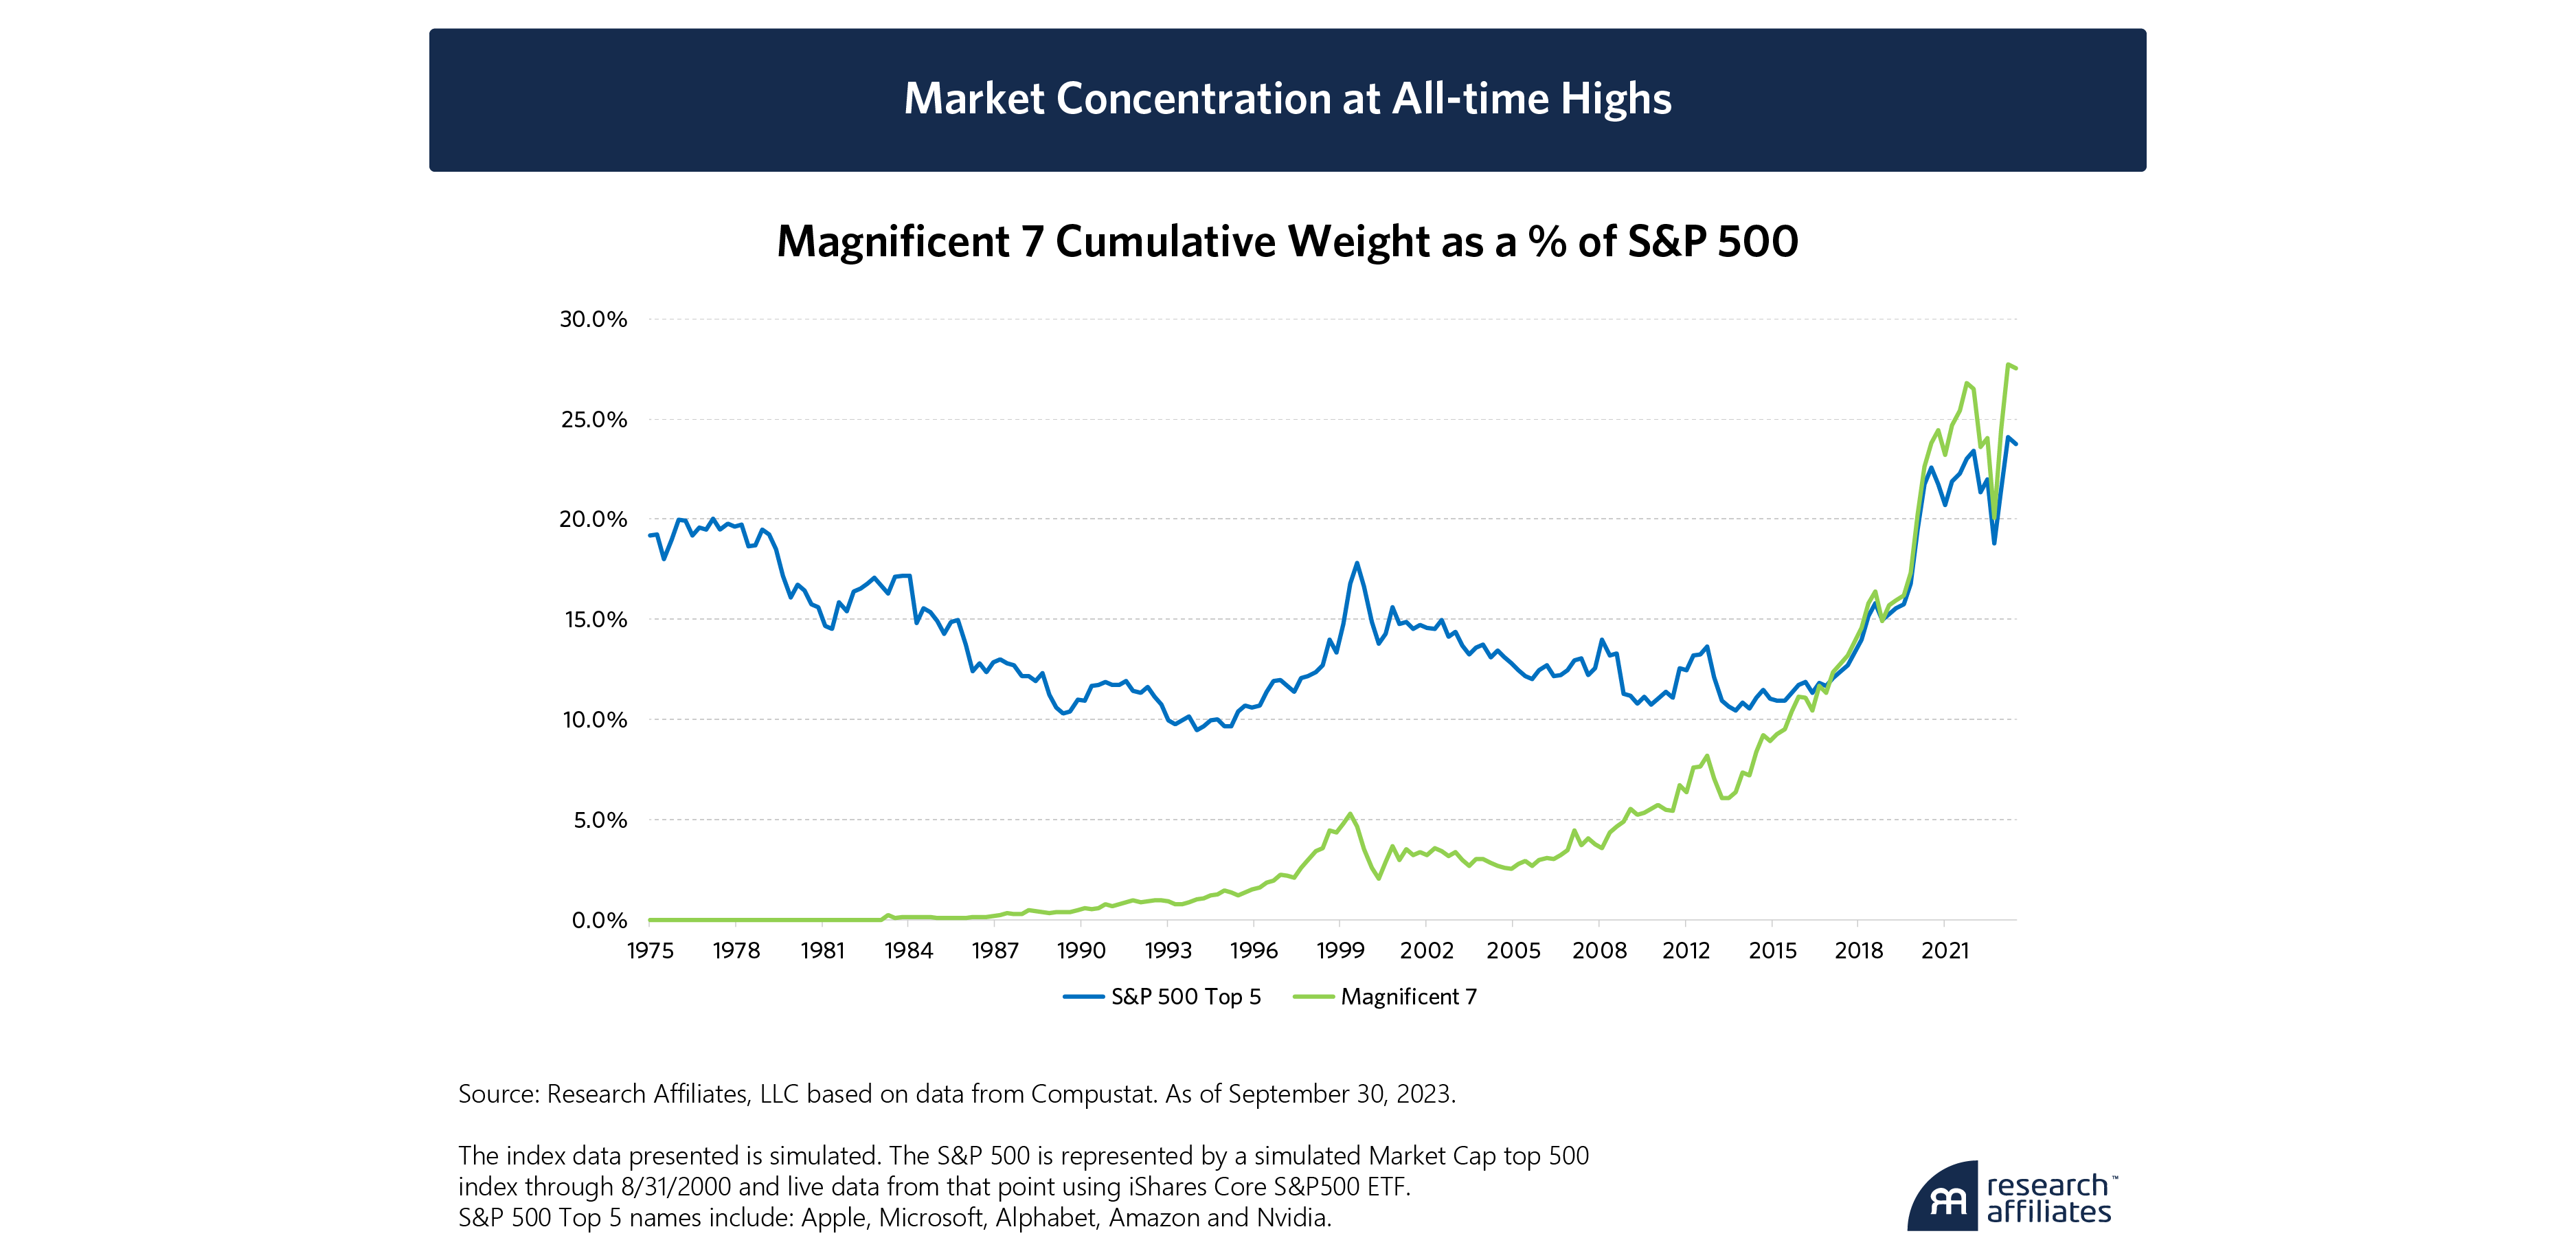
The Magnificent Seven has generated 70% of the overall S&P 500 return year-to-date, obscuring weakness across the overall market and creating a sense of complacency among some investors.
”Another investor concern may be the increasing dependence of market indexes on a few companies. Market concentration of the Magnificent Seven in the S&P 500 (Apple, Microsoft, Google, Amazon, Meta Platforms, Nvidia and Tesla) and similar cap weighted indexes is at its highest levels in history, even more pronounced than during the dot-com bubble in the late 1990s. While these companies are more fundamentally sound than their predecessors during the era of Pets.com and generate billions in earnings and cash flow, their dominance creates several risks. This group of mega cap growth stocks has generated 70% of the overall return of the S&P 500 year-to-date, obscuring weakness across the overall market and creating a sense of complacency among some investors.
Past periods of similar concentration have ultimately ended with a selloff among these focused leaders. The unraveling of the dot-com bubble began in March 2000 and ushered in a bear market that lasted two and half years. The leadership coming out of that downturn was much different from the growth and momentum cohort that led previously. Markets witnessed a similar rotation out of mega cap leadership in 2022 as the Fed’s aggressive tightening cycle ushered in a bear market by May and caused growth stocks to underperform value by over 2,400 basis points.
Indeed, the outsized influence of these companies on market averages magnifies the scrutiny of their fundamentals, leading some investors to worry that any blemishes could be a harbinger of more difficult times ahead. For such investors, alternatives to capitalization weighted indexes would provide better equity diversification. One option is to invest in an equal weighted version of the S&P 500 which would reduce the outsized influence of any single stock. In 2023, the cap weighted S&P has outperformed its equal weighted counterpart by the largest margin since 1998, further evidence of market concentration risk.
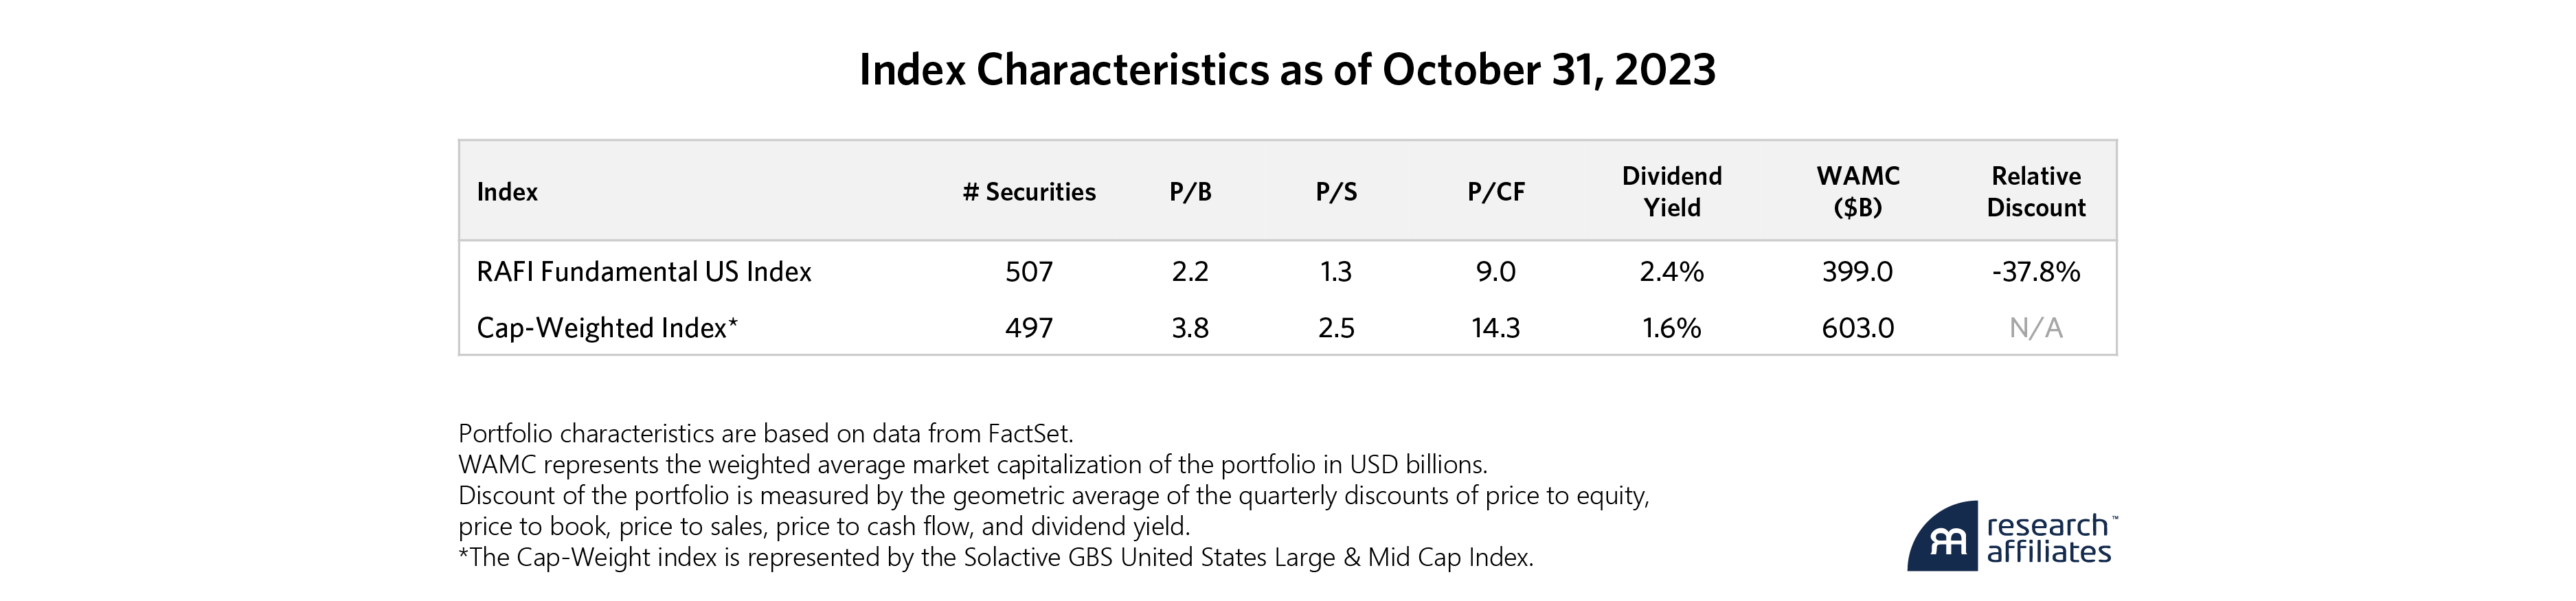
Alternative index composition options are also available that weight stocks based on fundamentals. Research Affiliates’ Fundamental Index provides such a solution. Although it owns many of the same companies as the cap weighted indexes, the companies are owned in proportion to their fundamental size – sales, book value, cash flow, dividends and buybacks. This results in a more diversified index with more attractive valuations. It also removes concentration risk while still allowing investors to participate in the mostly upward climb that has characterized the stock market in its close to 100 years of recorded history.
Conclusion
Recent equity market volatility is a normal part of the investment landscape. Even with higher interest rates, equity markets are not particularly overextended from a valuation, earnings or sentiment perspective. In short, equity fundamentals remain in a long period of boredom. The media may not like it, but such periods are good for equity investors. Given this backdrop, staying invested in equities is still a prudent policy. For investors concerned about the extreme concentration in popular capitalization weighted indexes, alternative options like the Research Affiliates Fundamental Indexes offer a diversified way to invest.
Please read our disclosures concurrent with this publication: https://www.researchaffiliates.com/legal/disclosures#investment-adviser-disclosure-and-disclaimers.

Endnotes
- Fed’s Stock Valuation Model (monthly): https://www.yardeni.com
- Cyclically adjusted earnings yields are derived from cyclically adjusted price-to-earnings data originally published by Robert Shiller and used in a popular model for measuring stock valuations since 1987: http://www.econ.yale.edu/~shiller/data/ie_data.xls
- American Association of Individual Investors Asset Allocation Survey, October 2023: https://www.aaii.com/assetallocationsurvey
